
Overview
This strategy is a dynamic zone trend following system based on dual EMAs (Fast and Slow). It classifies different trading zones based on the relative positions of price and EMAs, combined with a dynamic color indication system to provide clear buy/sell signals. The strategy adopts classical moving average crossover theory while innovating through zone classification to enhance the operability of traditional dual EMA systems.
Strategy Principle
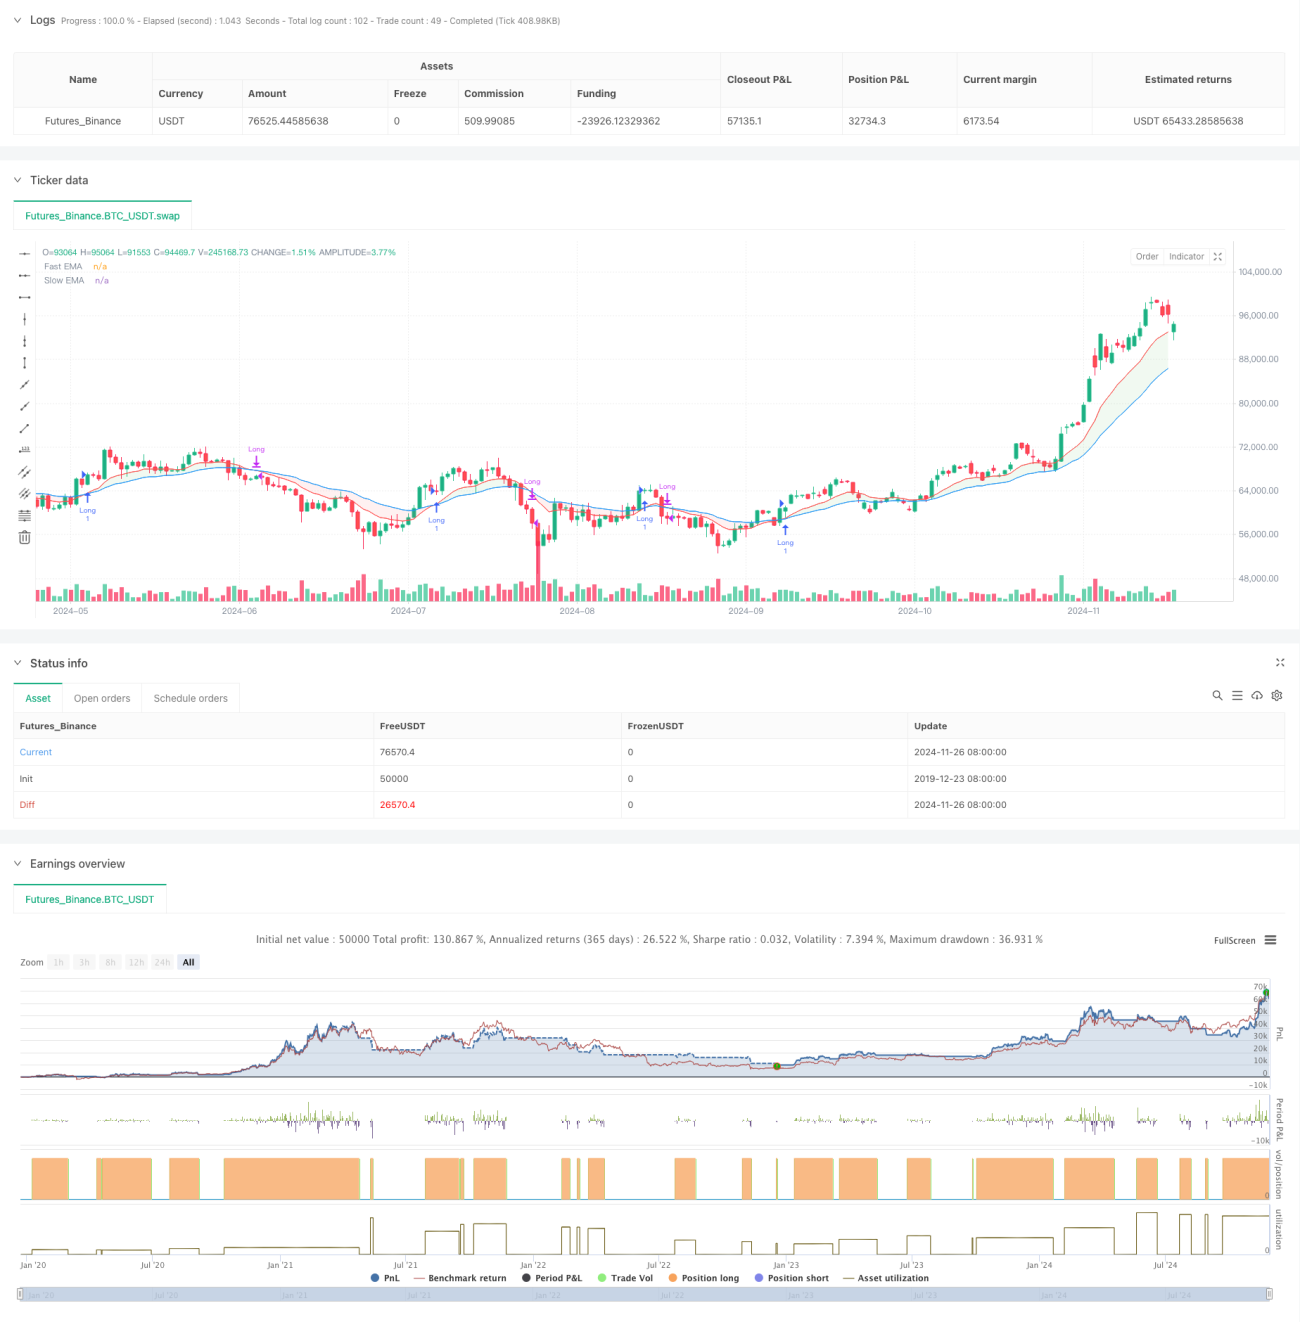
The core of the strategy lies in dividing market conditions into six distinct zones using the crossover relationship between Fast EMA (default 12 periods) and Slow EMA (default 26 periods), combined with price position. When the fast line is above the slow line, the market is considered bullish; conversely, it's considered bearish. The price position relative to these two moving averages further subdivides into specific trading zones: Green Zone (Buy), Blue Zone (Potential Buy), Red Zone (Sell), and Yellow Zone (Potential Sell). Buy signals are triggered when price enters the green zone and the first green candle appears, while sell signals are triggered when price enters the red zone and the first red candle appears.
Strategy Advantages
- Visual Intuitiveness: Dynamic color zone changes allow traders to visually assess market conditions and potential trading opportunities.
- Trend Confirmation: The dual EMA system provides reliable trend confirmation mechanisms, reducing false signals.
- Risk Management: Clear zone classification aids in setting stop-loss and take-profit strategies.
- High Adaptability: The strategy can be applied to different timeframes and is suitable for various market environments.
- Adjustable Parameters: EMA periods and smoothing parameters can be optimized for different market characteristics.
Strategy Risks
- Lag: Moving averages are inherently lagging indicators, potentially leading to delayed entry or exit timing.
- Ineffective in Ranging Markets: May generate frequent false signals in sideways markets.
- Trend Reversal Risk: Strategy may not respond quickly enough to sudden trend reversals.
- Parameter Dependency: Optimal parameters may vary significantly across different market environments.
Strategy Optimization Directions
- Introduce Volatility Filtering: Adjust trading conditions in high volatility environments to avoid false signals.
- Add Volume Confirmation: Incorporate volume indicators to enhance signal reliability.
- Dynamic Parameter Adjustment: Automatically adjust EMA periods based on market conditions.
- Include Trend Strength Indicators: Introduce ADX or similar indicators to evaluate trend strength.
- Optimize Stop Loss Strategy: Design dynamic stop-loss solutions based on ATR.
Summary
This is a trend following strategy that combines traditional dual EMA systems with modern zone classification concepts. Through intuitive visual feedback and clear trading rules, it provides traders with a reliable trading framework. While inherent lag issues exist with moving average systems, the strategy can achieve stable performance in trending markets through proper parameter optimization and risk management. Traders are advised to optimize parameters based on market characteristics and maintain appropriate risk control in practical applications.
/*backtest
start: 2019-12-23 08:00:00
end: 2024-11-27 08:00:00
period: 1d
basePeriod: 1d
exchanges: [{"eid":"Futures_Binance","currency":"BTC_USDT"}]
*/

//@version=5
strategy("NUTJP CDC ActionZone 2024", overlay=true, precision=6, commission_value=0.1, slippage=3)

//****************************************************************************//- 1