Multi-Exponential Moving Average Crossover Strategy with Volume-Based ATR Dynamic Stop-Loss Optimization

Overview
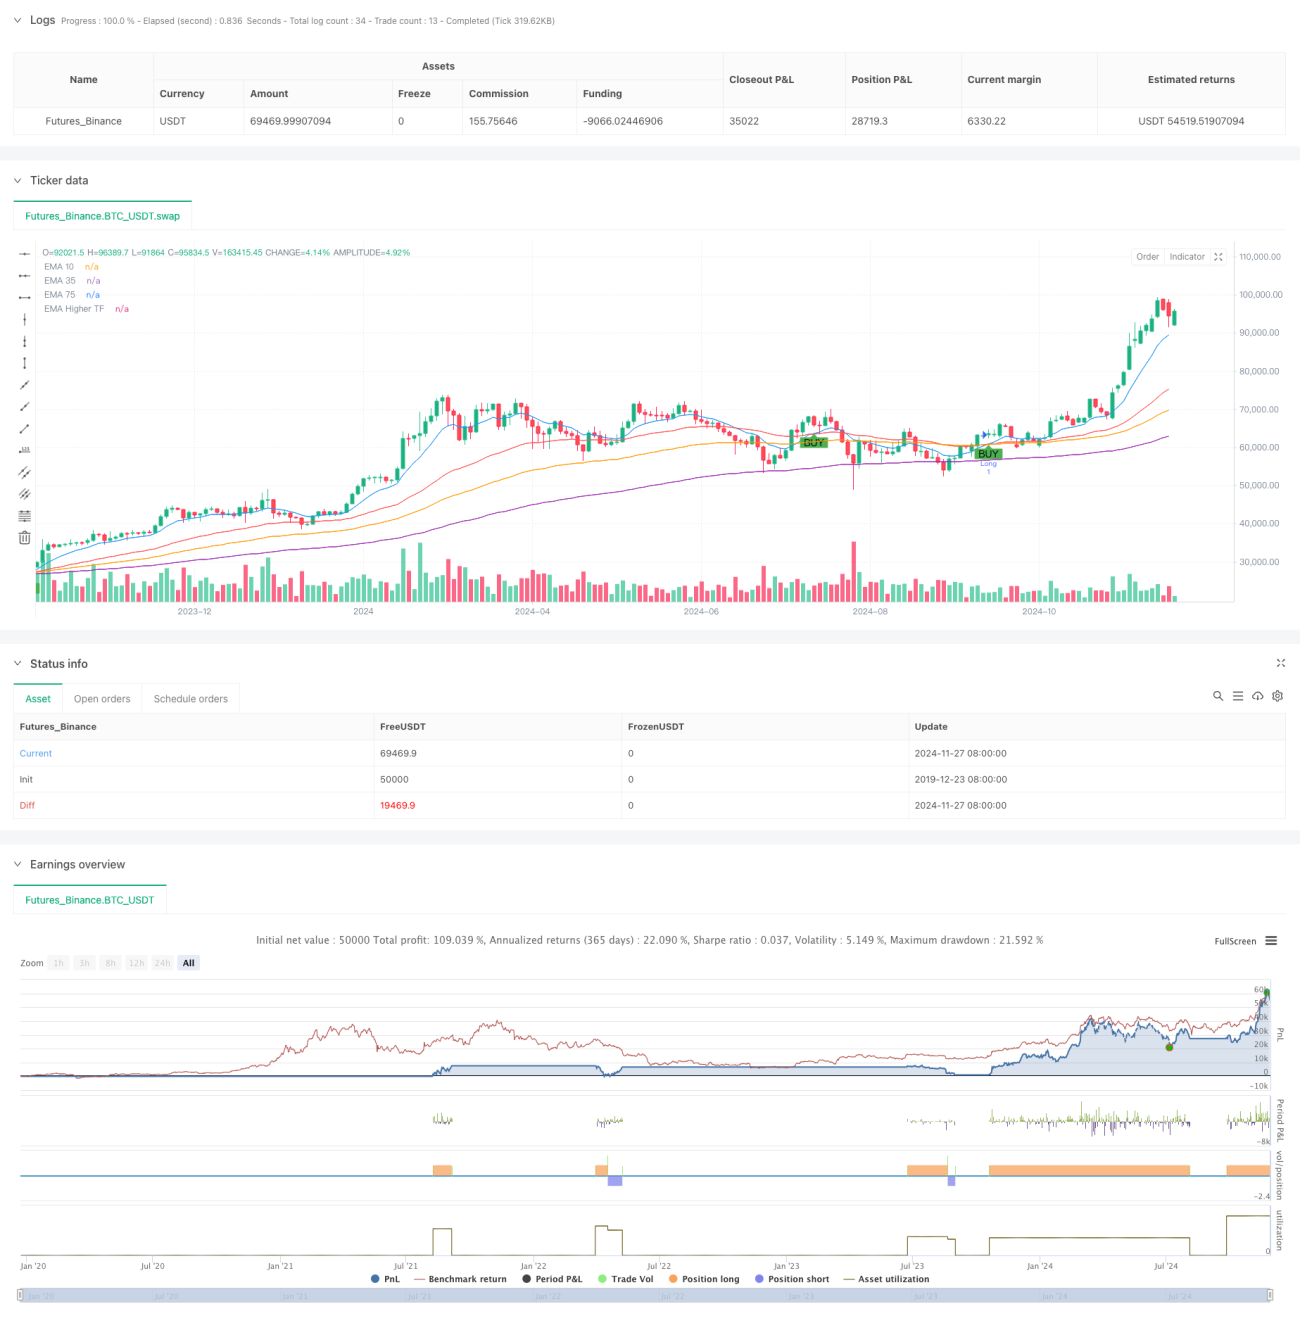
This strategy is a trading system based on multiple Exponential Moving Average (EMA) crossover signals, combining EMAs of different periods with an ATR-based dynamic stop-loss mechanism. The strategy utilizes EMAs of 10, 39, and 73 periods as primary signal indicators, while incorporating a 143-period higher timeframe EMA as a trend filter, and implements dynamic stop-loss and take-profit targets using the ATR indicator.
Strategy Principles
The core logic is based on multiple EMA crossovers and trend confirmation. A long signal is generated when the short-term EMA (10-period) crosses above the medium-term EMA (39-period), and price is above both the long-term EMA (73-period) and higher timeframe EMA (143-period). Conversely, a short signal is generated when the short-term EMA crosses below the medium-term EMA, and price is below both longer-term EMAs. The strategy implements a risk-reward ratio of 1:2 using 1x ATR for stop-loss and 2x ATR for take-profit targets.
Strategy Advantages
- Multiple timeframe confirmation: Integration of different period EMAs effectively reduces false breakout risks
- Dynamic stop-loss mechanism: ATR-based stops adapt to market volatility
- Trend following effectiveness: Higher timeframe EMA filtering ensures trade direction aligns with major trends
- Optimized risk-reward ratio: 1:2 risk-reward setting enhances expected returns
- High signal reliability: Multiple indicator confirmations significantly improve trade signal quality
Strategy Risks
- Ranging market risk: Frequent false signals may occur in sideways markets
- Lag risk: Multiple moving average systems have inherent lag, potentially missing optimal entry points
- Gap risk: Severe volatility may cause stop-loss failures
- Parameter sensitivity: Multiple timeframe parameter selection significantly impacts strategy performance
- Market environment dependence: Strategy performs better in strong trends but may underperform in other conditions
Strategy Optimization Directions
- Incorporate volume indicators: Add volume confirmation to enhance signal reliability
- Add trend strength filtering: Consider including ADX or other trend strength indicators
- Optimize parameter adaptation: Dynamically adjust EMA parameters based on market conditions
- Improve stop-loss mechanism: Consider adding trailing stops or composite stop-loss strategies
- Enhanced market environment analysis: Introduce volatility indicators for market condition classification
Summary
This strategy builds a trading system combining trend following and risk management through multiple EMA crossovers and ATR-based dynamic stops. Its main strengths lie in multiple timeframe confirmation mechanisms and dynamic position management, while being mindful of ranging market and lag risks. Strategy stability and profitability can be further enhanced through volume confirmation, trend strength filtering, and other optimizations. In practical application, parameters should be adjusted according to different market environments and trading instrument characteristics.
- 1