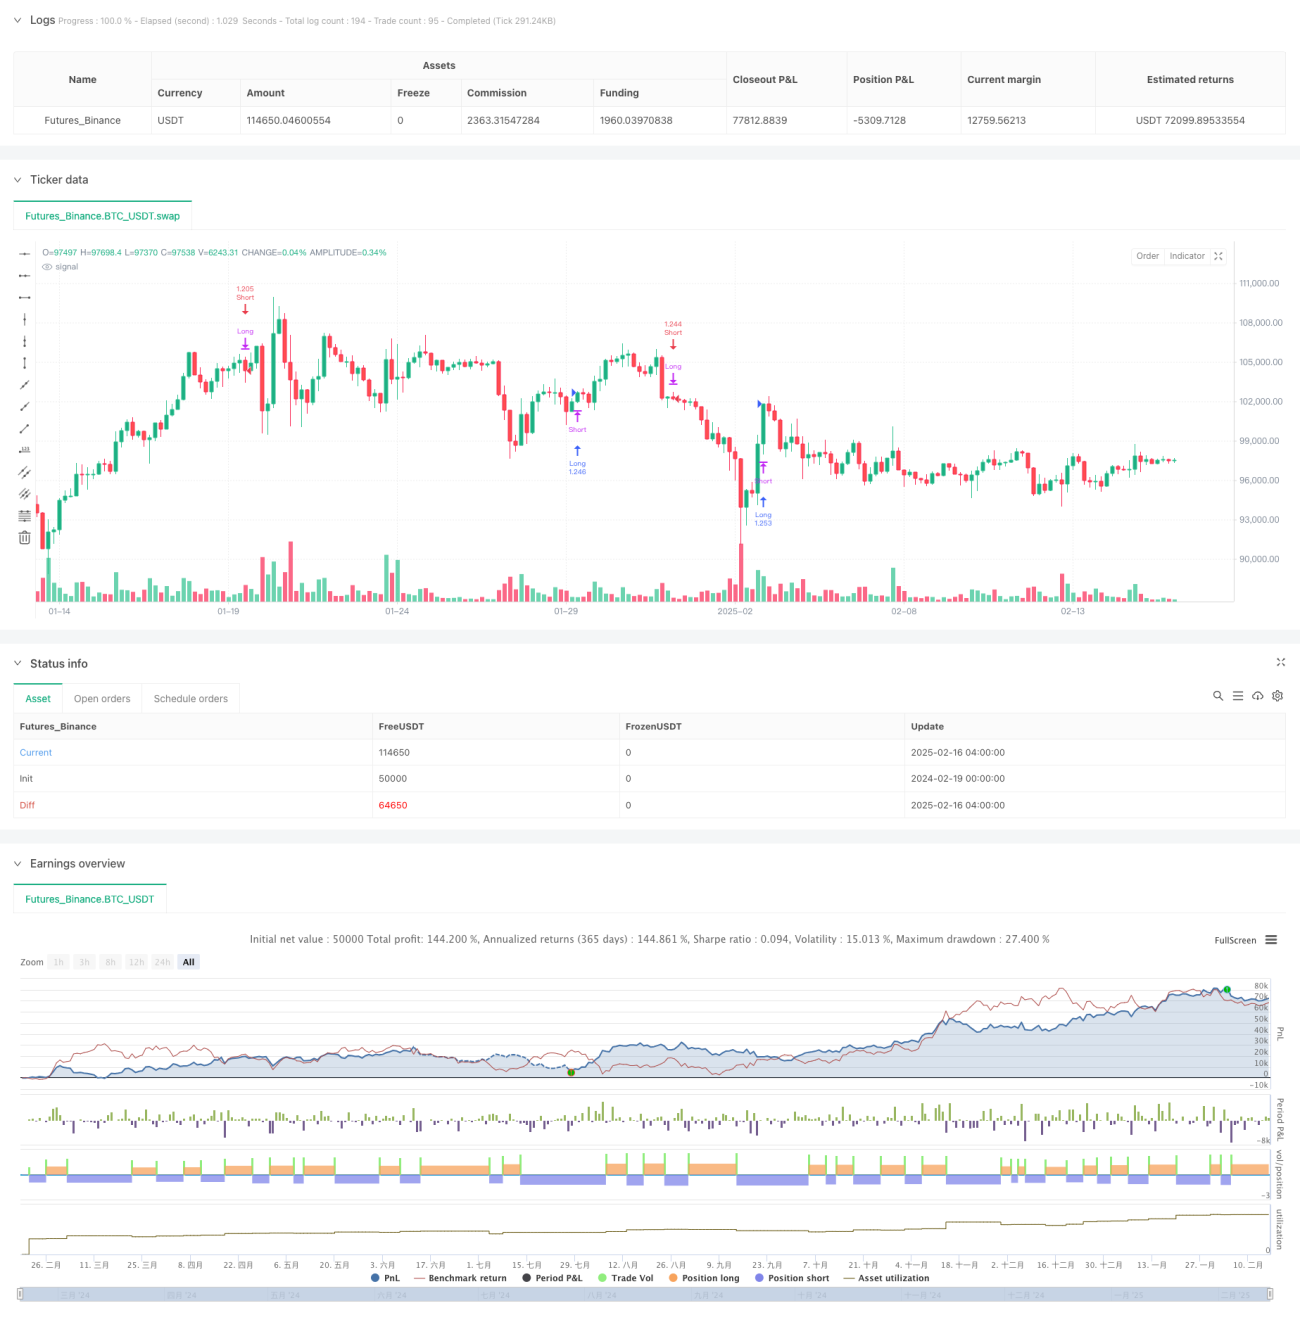
该策略是一个基于增强型相对强弱指标(RSI)的趋势跟踪交易系统。它通过计算RSI的改良版本并结合其信号线,在不同市场周期捕捉趋势反转机会。该策略不仅计算指标值,还通过视觉上的超买超卖区域展示,帮助交易者更直观地判断市场状态。
策略的核心原理是通过增强型RSI(ARSI)的计算来识别市场趋势。具体包括: 1. 计算指定周期内的最高价和最低价,得到价格区间 2. 基于价格变化计算差值 3. 使用可选的移动平均方法(EMA、SMA、RMA、TMA)对差值进行平滑处理 4. 将结果标准化到0-100范围内 5. 当ARSI在50以下穿越信号线时产生做多信号 6. 当ARSI在50以上跌破信号线时产生做空信号
这是一个结构完整、逻辑清晰的趋势跟踪策略。通过增强型RSI的创新计算方法,结合多种技术指标的优势,形成了一个可靠的交易系统。虽然存在一些固有风险,但通过合理的优化和风险管理措施,该策略具有良好的实战应用前景。建议交易者在实盘使用时,需要充分测试参数设置,并结合市场环境适时调整策略配置。
/*backtest
start: 2024-02-19 00:00:00
end: 2025-02-16 08:00:00
period: 4h
basePeriod: 4h
exchanges: [{"eid":"Futures_Binance","currency":"BTC_USDT"}]
*/
//@version=6
strategy("Ultimate RSI [LuxAlgo] Strategy", shorttitle="ULT RSI Strat", overlay=false, initial_capital=10000, currency=currency.USD, default_qty_type=strategy.percent_of_equity, default_qty_value=100)
//------------------------------------------------------------------------------
// Settings
//------------------------------------------------------------------------------
length = input.int(14, minval=2, title="RSI Length")
smoType1 = input.string("RMA", title="Method", options=["EMA", "SMA", "RMA", "TMA"])
src = input(close, title="Source")
arsiCss = input.color(color.silver, "RSI Color", inline="rsicss")
autoCss = input.bool(true, "Auto", inline="rsicss")
// Signal Line settings
smooth = input.int(14, minval=1, title="Signal Smooth", group="Signal Line")
smoType2 = input.string("EMA", title="Method", options=["EMA", "SMA", "RMA", "TMA"], group="Signal Line")
signalCss = input.color(color.new(#ff5d00, 0), "Signal Color", group="Signal Line")
// Overbought/Oversold style
obValue = input.float(80, "Overbought", inline="ob", group="OB/OS Style")
obCss = input.color(color.new(#089981, 0), "", inline="ob", group="OB/OS Style")
obAreaCss = input.color(color.new(#089981, 80), "", inline="ob", group="OB/OS Style")
osValue = input.float(20, "Oversold", inline="os", group="OB/OS Style")
osCss = input.color(color.new(#f23645, 0), "", inline="os", group="OB/OS Style")
osAreaCss = input.color(color.new(#f23645, 80), "", inline="os", group="OB/OS Style")
//------------------------------------------------------------------------------
// Function: Moving Average (selectable type)
//------------------------------------------------------------------------------
ma(x, len, maType)=>
switch maType
"EMA" => ta.ema(x, len)
"SMA" => ta.sma(x, len)
"RMA" => ta.rma(x, len)
"TMA" => ta.sma(ta.sma(x, len), len)
//------------------------------------------------------------------------------
// Augmented RSI Calculation
//------------------------------------------------------------------------------
upper = ta.highest(src, length)
lower = ta.lowest(src, length)
r = upper - lower
d = src - src[1]
diff = upper > upper[1] ? r : lower < lower[1] ? -r : d
num = ma(diff, length, smoType1)
den = ma(math.abs(diff), length, smoType1)
arsi = den != 0 ? num / den * 50 + 50 : 50 // safeguard against division by zero
signal = ma(arsi, smooth, smoType2)
//------------------------------------------------------------------------------
// Strategy Entry Conditions
//------------------------------------------------------------------------------
// Long entry: Ultimate RSI crosses above its signal when it is below 50 (lower half)
// Short entry: Ultimate RSI crosses below its signal when it is above 50 (upper half)
longCondition = ta.crossover(arsi, signal) and arsi < 50
shortCondition = ta.crossunder(arsi, signal) and arsi > 50
// Close opposite positions when conditions occur
if shortCondition
strategy.close("Long")
if longCondition
strategy.close("Short")
// Place new entries based on the conditions
if longCondition
strategy.entry("Long", strategy.long)
if shortCondition
strategy.entry("Short", strategy.short)
// //------------------------------------------------------------------------------
// // Plots and Constant Lines
// //------------------------------------------------------------------------------
// // Plot the Ultimate RSI and its Signal
// plot_rsi = plot(arsi, title="Ultimate RSI",
// color = arsi > obValue ? obCss : arsi < osValue ? osCss : autoCss ? chart.fg_color : arsiCss,
// linewidth=2)
// plot(signal, title="Signal Line", color=signalCss, linewidth=2)
// // Instead of using hline, create constant plots for OB, Midline, and OS
// plot_ob = plot(obValue, title="Overbought", color=obCss, style=plot.style_line, linewidth=1)
// plot_mid = plot(50, title="Midline", color=color.gray, style=plot.style_line, linewidth=1)
// plot_os = plot(osValue, title="Oversold", color=osCss, style=plot.style_line, linewidth=1)
// //------------------------------------------------------------------------------
// // Fill OB/OS Areas for Visual Clarity
// //------------------------------------------------------------------------------
// fill(plot_rsi, plot_ob, color=arsi > obValue ? obAreaCss : na)
// fill(plot_os, plot_rsi, color=arsi < osValue ? osAreaCss : na)