
概述
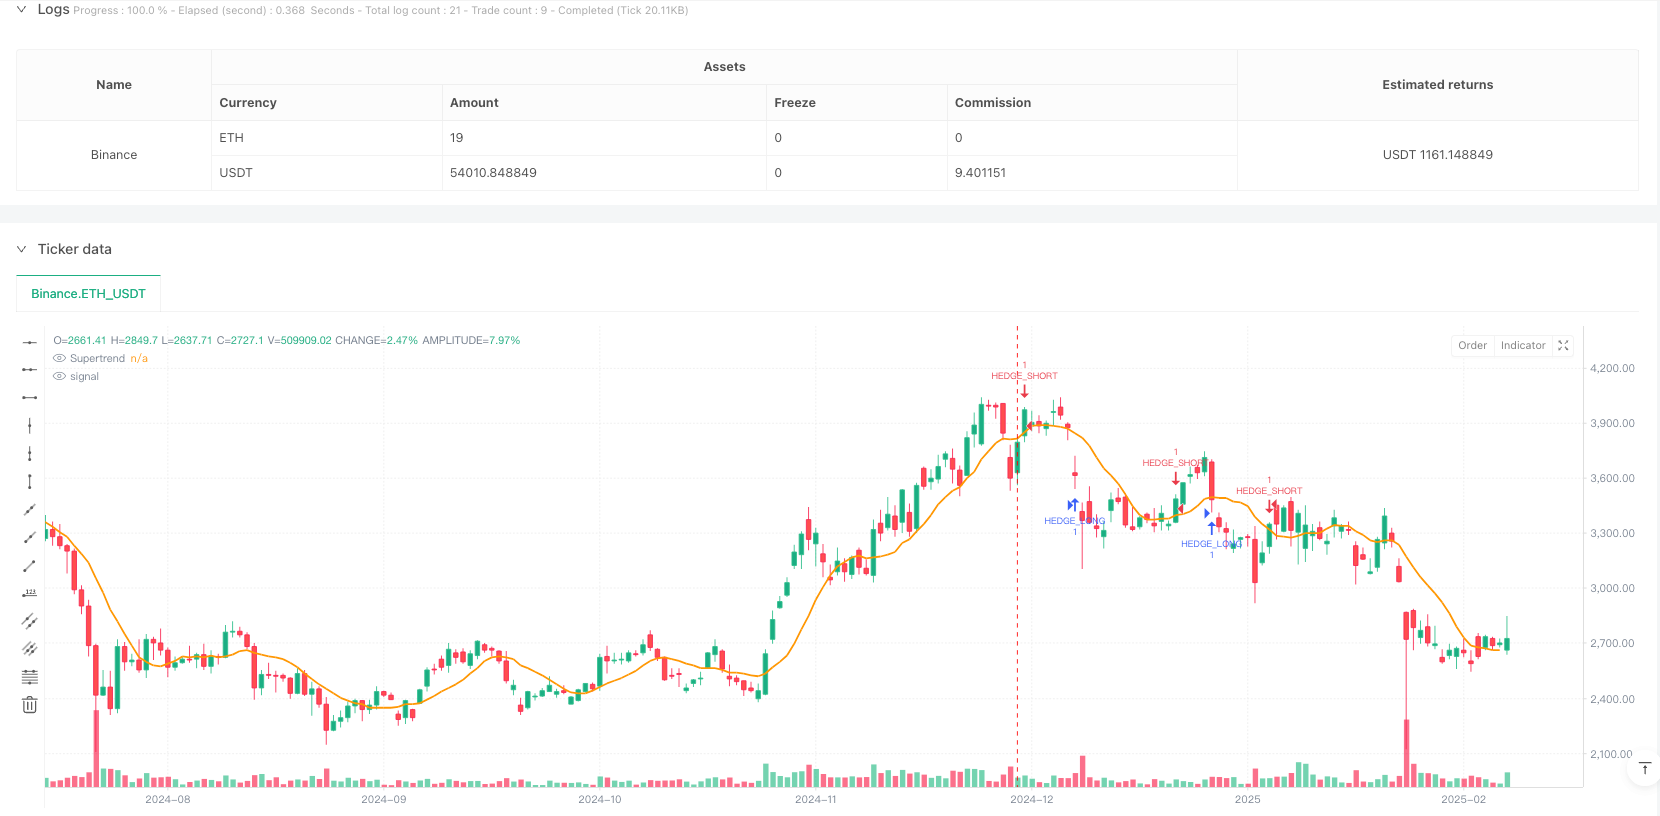
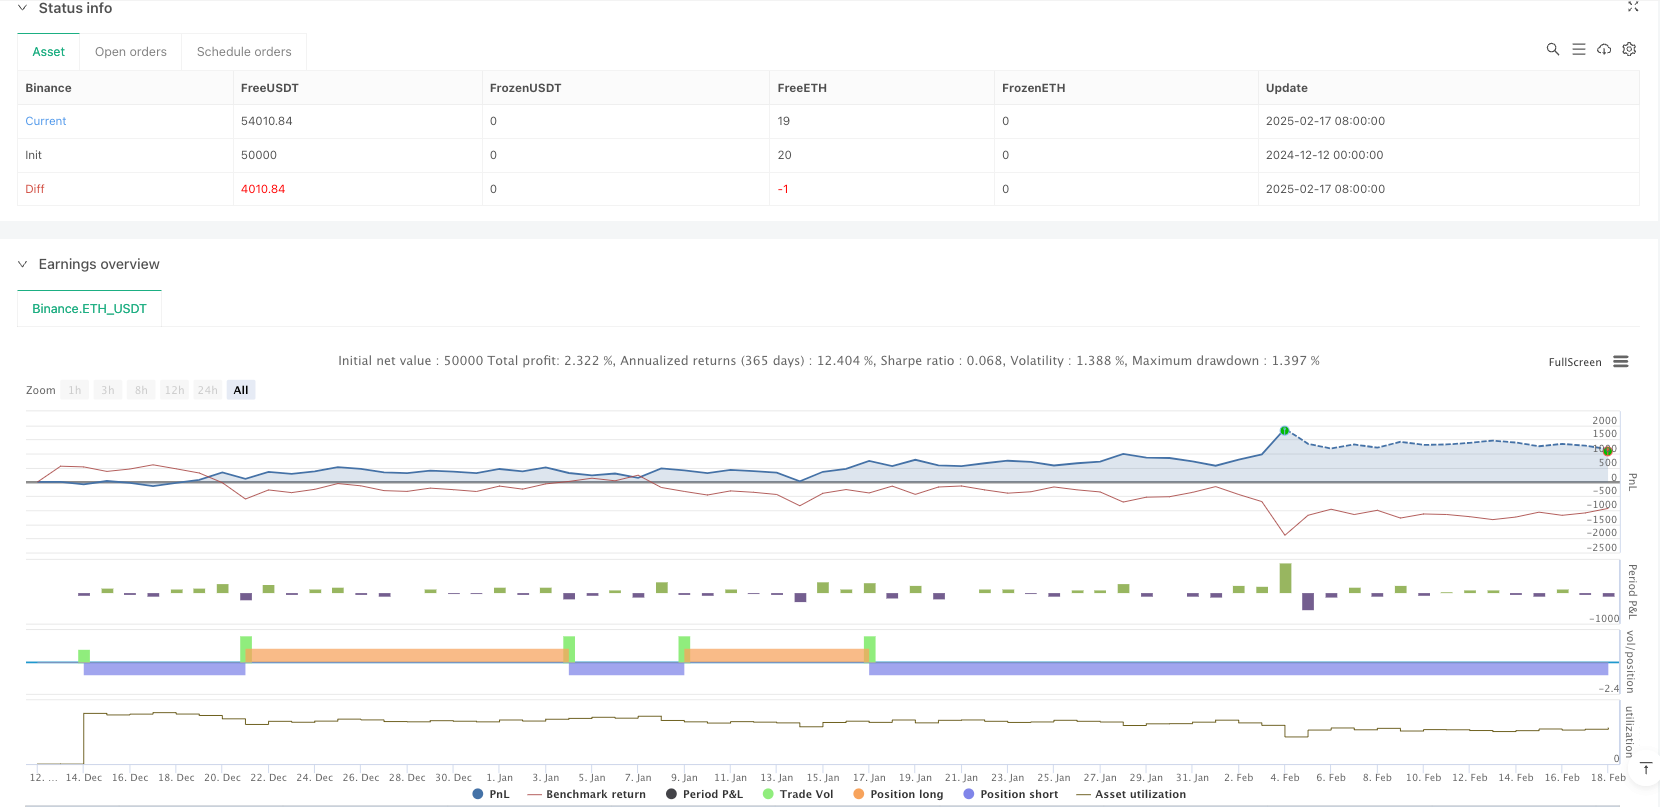
该策略是一个基于做市商行为和机构级流动性分析的交易系统。它通过追踪市场流动性指标、订单簿失衡和做市商足迹来识别高概率交易机会。策略融合了动态成本平均(DCAA)方法与对冲流动性系统,以实现风险最小化和收益最大化。该系统完全摒弃了传统技术指标,转而依赖于机构级别的市场微观结构分析。
策略原理
策略的核心是通过多维度数据来追踪做市商行为: 1. 使用VWAP(成交量加权平均价格)来确认机构吸筹/出货位置 2. 通过CVD(累计成交量差)来检测多空双方的实际力量对比 3. 结合订单簿数据来识别流动性陷阱和止损猎杀区域 4. 通过动态成本平均方法在关键支撑位建立分批建仓系统 5. 配合对冲系统在市场剧烈波动时进行风险管理
策略优势
- 完全基于市场微观结构,避免了技术指标滞后的问题
- 通过对做市商行为的分析,能够提前预测大规模价格波动
- 动态成本平均系统能够在下跌中逐步建仓,降低整体持仓成本
- 对冲系统提供了额外的风险保护层,特别是在市场剧烈波动时期
- 策略可以实时适应市场条件,不依赖于静态支撑阻力位
策略风险
- 需要实时高质量的市场数据,对数据延迟较为敏感
- 在市场流动性极度缺乏时可能难以准确判断做市商意图
- 过度依赖做市商行为分析可能在某些市场条件下产生误判
- 动态成本平均系统在持续下跌市场中可能积累较大亏损
- 对冲策略的成本可能在横盘市场中侵蚀盈利
策略优化方向
- 引入机器学习算法来提高做市商行为识别的准确性
- 优化动态成本平均系统的资金分配比例
- 增加更多的市场微观结构指标来提高信号可靠性
- 开发自适应的对冲比例调整机制
- 建立更完善的风险控制系统,特别是在极端市场条件下
总结
这是一个建立在市场微观结构基础上的机构级交易策略。通过对做市商行为的深入分析,结合动态成本平均和对冲系统,策略能够在不同市场环境下保持稳定性。虽然策略实施需要克服一些技术和操作上的挑战,但其核心理念和方法论具有扎实的市场微观结构基础,具备长期稳定盈利的潜力。
策略源码
/*backtest
start: 2024-12-12 00:00:00
end: 2025-02-18 08:00:00
period: 1d
basePeriod: 1d
exchanges: [{"eid":"Binance","currency":"ETH_USDT"}]
*/

//@version=6
strategy("EDGE Market Maker Strategy – DCAA & HedgeFlow", overlay=true)

// ✅ Import Indicators
vwapLine = ta.vwap
superTrend = ta.sma(close, 10)  // Replace with actual Supertrend formula if needed
volData = volume // Volume from current timeframe
cvdData = ta.cum(close - close[1]) // Approximation of CVD (Cumulative Volume Delta)
orderBlockHigh = ta.highest(high, 20) // Approximate Order Block Detection
orderBlockLow = ta.lowest(low, 20)

// ✅ Market Maker Buy Conditions
longCondition = ta.crossover(close, vwapLine) and cvdData > cvdData[1] and volData > volData[1]
if longCondition
    strategy.entry("BUY", strategy.long)

// ✅ Market Maker Sell Conditions
shortCondition = ta.crossunder(close, vwapLine) and cvdData < cvdData[1] and volData > volData[1]
if shortCondition
    strategy.entry("SELL", strategy.short)

// ✅ Order Block Confirmation (For Stronger Signals)
longOB = longCondition and close > orderBlockHigh
shortOB = shortCondition and close < orderBlockLow

if longOB
    label.new(bar_index, high, "BUY (Order Block)", color=color.green, textcolor=color.white, style=label.style_label_down)

if shortOB
    label.new(bar_index, low, "SELL (Order Block)", color=color.red, textcolor=color.white, style=label.style_label_up)

// ✅ DCAA Levels – Adaptive Re-Entry Strategy
dcaaBuy1 = close * 0.97  // First re-entry for long position (3% drop)
dcaaBuy2 = close * 0.94  // Second re-entry for long position (6% drop)
dcaaSell1 = close * 1.03 // First re-entry for short position (3% rise)
dcaaSell2 = close * 1.06 // Second re-entry for short position (6% rise)

if longCondition
    strategy.entry("DCAA_BUY_1", strategy.long, limit=dcaaBuy1)
    strategy.entry("DCAA_BUY_2", strategy.long, limit=dcaaBuy2)

if shortCondition
    strategy.entry("DCAA_SELL_1", strategy.short, limit=dcaaSell1)
    strategy.entry("DCAA_SELL_2", strategy.short, limit=dcaaSell2)

// ✅ HedgeFlow System – Dynamic Hedge Adjustments
hedgeLong = ta.crossunder(close, superTrend) and cvdData < cvdData[1] and volData > volData[1]
hedgeShort = ta.crossover(close, superTrend) and cvdData > cvdData[1] and volData > volData[1]

if hedgeLong
    strategy.entry("HEDGE_LONG", strategy.long)

if hedgeShort
    strategy.entry("HEDGE_SHORT", strategy.short)

// ✅ Take Profit & Stop Loss
tpLong = close * 1.05
tpShort = close * 0.95
slLong = close * 0.97
slShort = close * 1.03

strategy.exit("TP_Long", from_entry="BUY", limit=tpLong, stop=slLong)
strategy.exit("TP_Short", from_entry="SELL", limit=tpShort, stop=slShort)

// ✅ Plot VWAP & Supertrend for Reference
plot(vwapLine, title="VWAP", color=color.blue, linewidth=2)
plot(superTrend, title="Supertrend", color=color.orange, linewidth=2)
相关推荐