Multi-Indicator ATR Trailing Stop Smart Trading Strategy

Overview
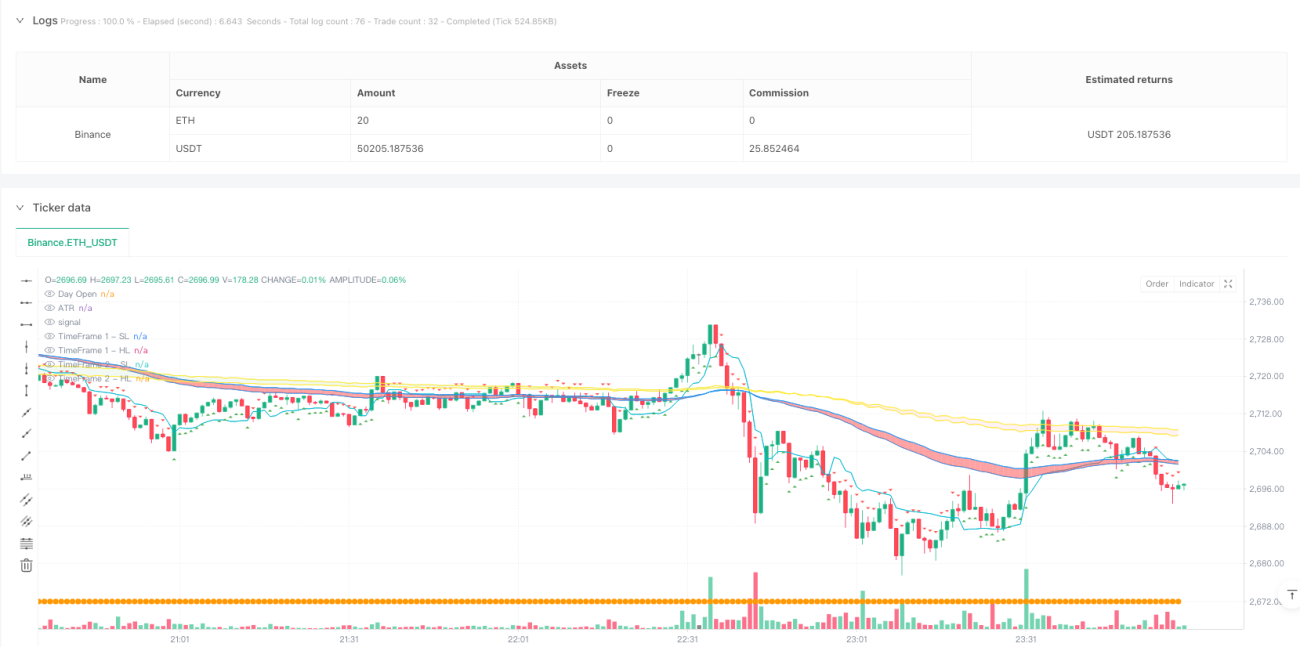
This is an intelligent trading strategy that combines multiple technical indicators, primarily based on the ATR indicator for trailing stop loss functionality. The strategy integrates JLines Cloud, volume analysis, and daily opening price among other multi-dimensional analytical indicators, particularly suitable for trading on 3-minute and 5-minute timeframes. The strategy dynamically adjusts stop-loss positions through ATR while using moving average systems to determine trend direction, creating a comprehensive trading decision system.
Strategy Principles
The core of the strategy is a trailing stop system built on the ATR (Average True Range) indicator. It uses a 10-period ATR with a 2x ATR multiplier to calculate dynamic stop lines. It also incorporates the JLines Cloud system (72/89 EMA combination) across two timeframes, plus an optional 5/15 EMA system. Trade signals are generated based on:
- ATR trailing stop line breakouts
- Consistent trends across both timeframe JLines Clouds
- Price position relative to daily opening price
- Confirmation from unusual volume activity
Strategy Advantages
- Dynamic Stop Protection - Self-adapts to market volatility through ATR indicator
- Multi-dimensional Trend Confirmation - Improves trend judgment accuracy using different timeframe moving average combinations
- Volume Verification - Enhances trade confirmation through unusual volume analysis
- Comprehensive Risk Management - Includes dual protection mechanism with fixed stops and profit targets
- High Adaptability - Parameters can be adjusted for different market conditions
Strategy Risks
- Parameter Sensitivity - ATR period and multiplier choices significantly impact strategy performance
- Market Condition Dependency - May generate frequent false signals in ranging markets
- Multiple Condition Restrictions - Strict entry conditions might lead to missed trading opportunities
- Slippage Impact - Actual execution prices may significantly deviate from signal prices during high volatility
Strategy Optimization Directions
- Dynamic Parameter Adjustment - Automatically adjust ATR parameters based on market volatility
- Time Filters - Add trading time filters to avoid high volatility periods at market open and close
- Trend Strength Filtering - Introduce trend strength indicators to improve trend judgment accuracy
- Risk Management Optimization - Implement dynamic profit/loss ratios for different market environments
- Enhanced Volume Analysis - Refine volume analysis methods to improve trade confirmation accuracy
Summary
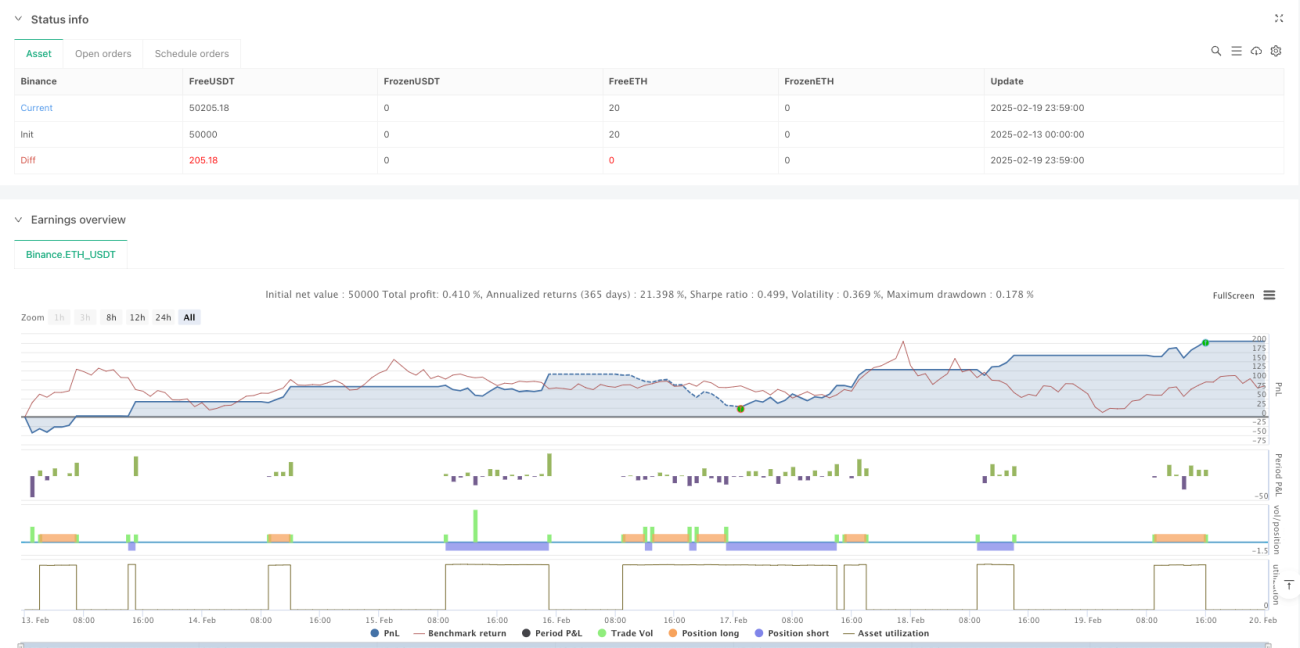
This is a complete trading system that integrates multiple technical indicators, providing core risk management through ATR trailing stops while utilizing moving average clouds and volume analysis for trade confirmation. The strategy's strength lies in its comprehensive market analysis framework and robust risk management system, though parameter optimization is needed for specific market environments. Through the suggested optimization directions, the strategy's stability and profitability can be further enhanced.
- 1