Triple Resonance Capture Strategy

Three Indicators Must Signal Within 2 Bars, Otherwise No Deal
This isn't your average multi-indicator strategy. The WaveTrend + Connors RSI + Linear Regression Deviation combo hinges on window synchronization: all buy signals must appear within a 2-bar range, isolated signals get ignored. This design directly filters out 90% of false signals.
Traditional strategies either let indicators work independently (creating noise) or require simultaneous triggers (missing opportunities). This strategy finds the sweet spot: a 2-bar tolerance window ensures signal correlation while avoiding overly strict synchronization requirements.
WaveTrend -48 Oversold Line, More Sensitive Than Standard RSI
WT length set to 10 periods, oversold at -48, overbought at 48. This parameter combo is more aggressive than traditional RSI's 30/70, catching price reversal signals earlier. WT's advantage lies in combining price position with volatility, making it more reliable than pure RSI in choppy markets.
The key is WT's calculation: (Typical Price - EMA) / (0.015 * Deviation EMA). This formula naturally incorporates volatility adjustment. When market volatility spikes, the denominator increases, keeping WT values relatively stable and avoiding the distortion common RSI suffers during high-volatility periods.
Connors RSI Triple Verification, 20/80 Thresholds Have Deep Purpose
CRSI isn't ordinary RSI - it fuses price RSI, streak RSI, and price change percentile ranking. The 20 oversold threshold is more aggressive than traditional 30, but CRSI's triple verification mechanism reduces false signal probability.
The 6-period RSI length is deliberately short to enhance signal sensitivity. On 15-minute timeframes, 6 periods equals 1.5 hours of price memory - enough to catch short-term oversold conditions without excessive lag. This parameter works particularly well for 24/7 traded assets like BTC.
Linear Regression Deviation LSDD, 20 Periods Capture Trend Shifts
LSDD = Current Price - Linear Regression Value. When LSDD crosses above 0, it signals price starting to deviate from the downtrend line. The 20-period setting covers 5 hours on 15-minute charts, effectively identifying medium-term trend changes.
This indicator's brilliance lies in measuring trend deviation rather than simple trend following. When price consistently falls then starts deviating upward from the regression line, it often signals rebound initiation. Combined with WT and CRSI oversold signals, it creates "oversold + trend reversal" dual confirmation.
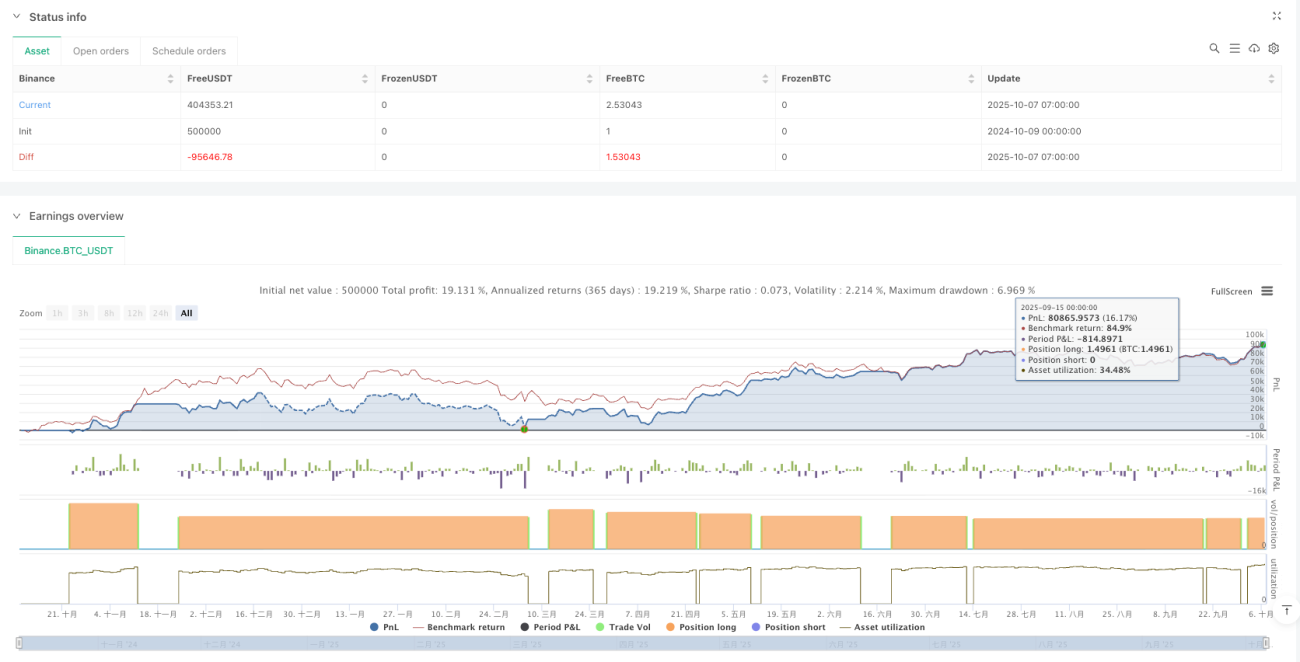
Long-Only, 30% Position Size, 1x Pyramiding
Strategy designed as pure long-only, 30% capital per entry, allowing 1 additional position. This setup suits cryptocurrency's long-term uptrend while managing risk through position control. 30% single position size provides adequate returns while avoiding excessive single-trade risk.
Exit conditions are equally strict: WT overbought (>48) AND CRSI overbought (>80) AND LSDD negative - all three must align. This design ensures trend trading completeness, preventing premature exits.
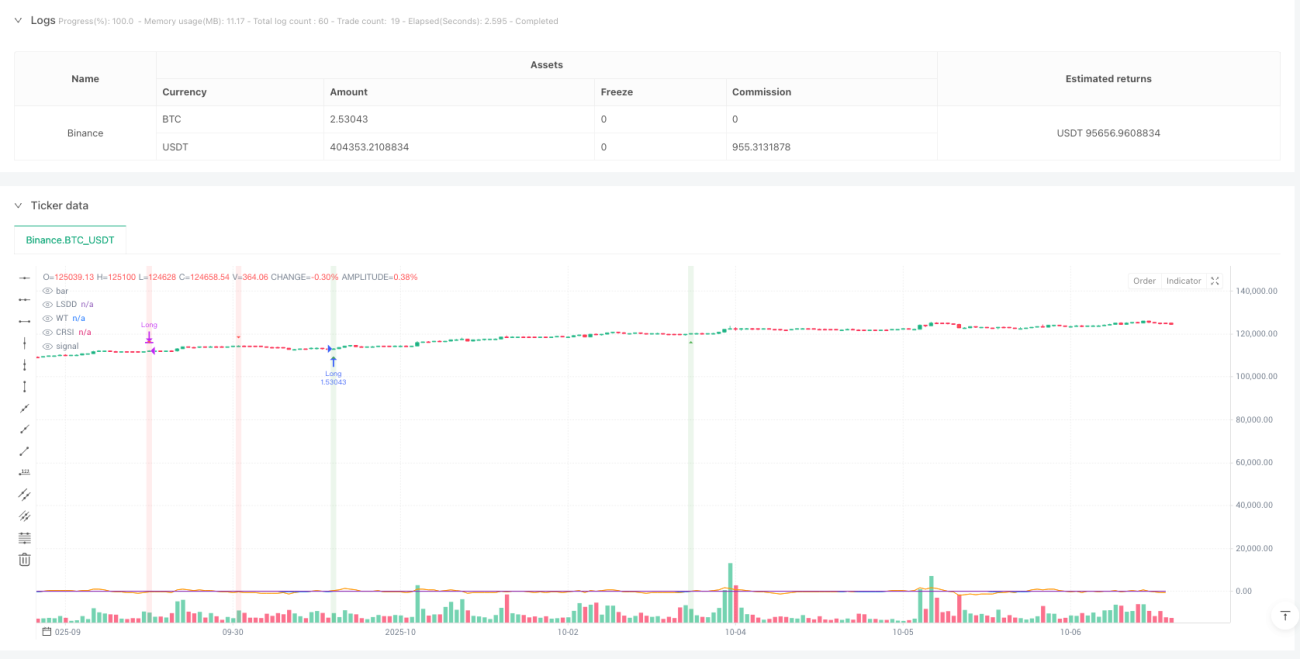
15-Minute BTC Backtest Optimized, But Market Environment Matters
Strategy performs well in BTC 15-minute backtests, but this doesn't guarantee effectiveness across all market environments. In sideways choppy markets, even triple confirmation may generate false signals. Strategy works best in markets with clear trending characteristics.
Risk Warning: Historical backtests don't guarantee future returns. Cryptocurrency markets are extremely volatile with potential for capital loss. Recommend thorough paper trading validation before live implementation and strict overall position control.
/*backtest
start: 2024-10-09 00:00:00
end: 2025-10-07 08:00:00
period: 1h
basePeriod: 1h
exchanges: [{"eid":"Binance","currency":"BTC_USDT","balance":500000}]
*/

//@version=5
// This source code is subject to the terms of the Mozilla Public License 2.0 at https://mozilla.org/MPL/2.0/
// © alescha13
// WT + CRSI + Linear Regression Long-only Strategy- 1