দীর্ঘ-সংক্ষিপ্ত রৈখিক ক্রসওভার কৌশল
ওভারভিউ
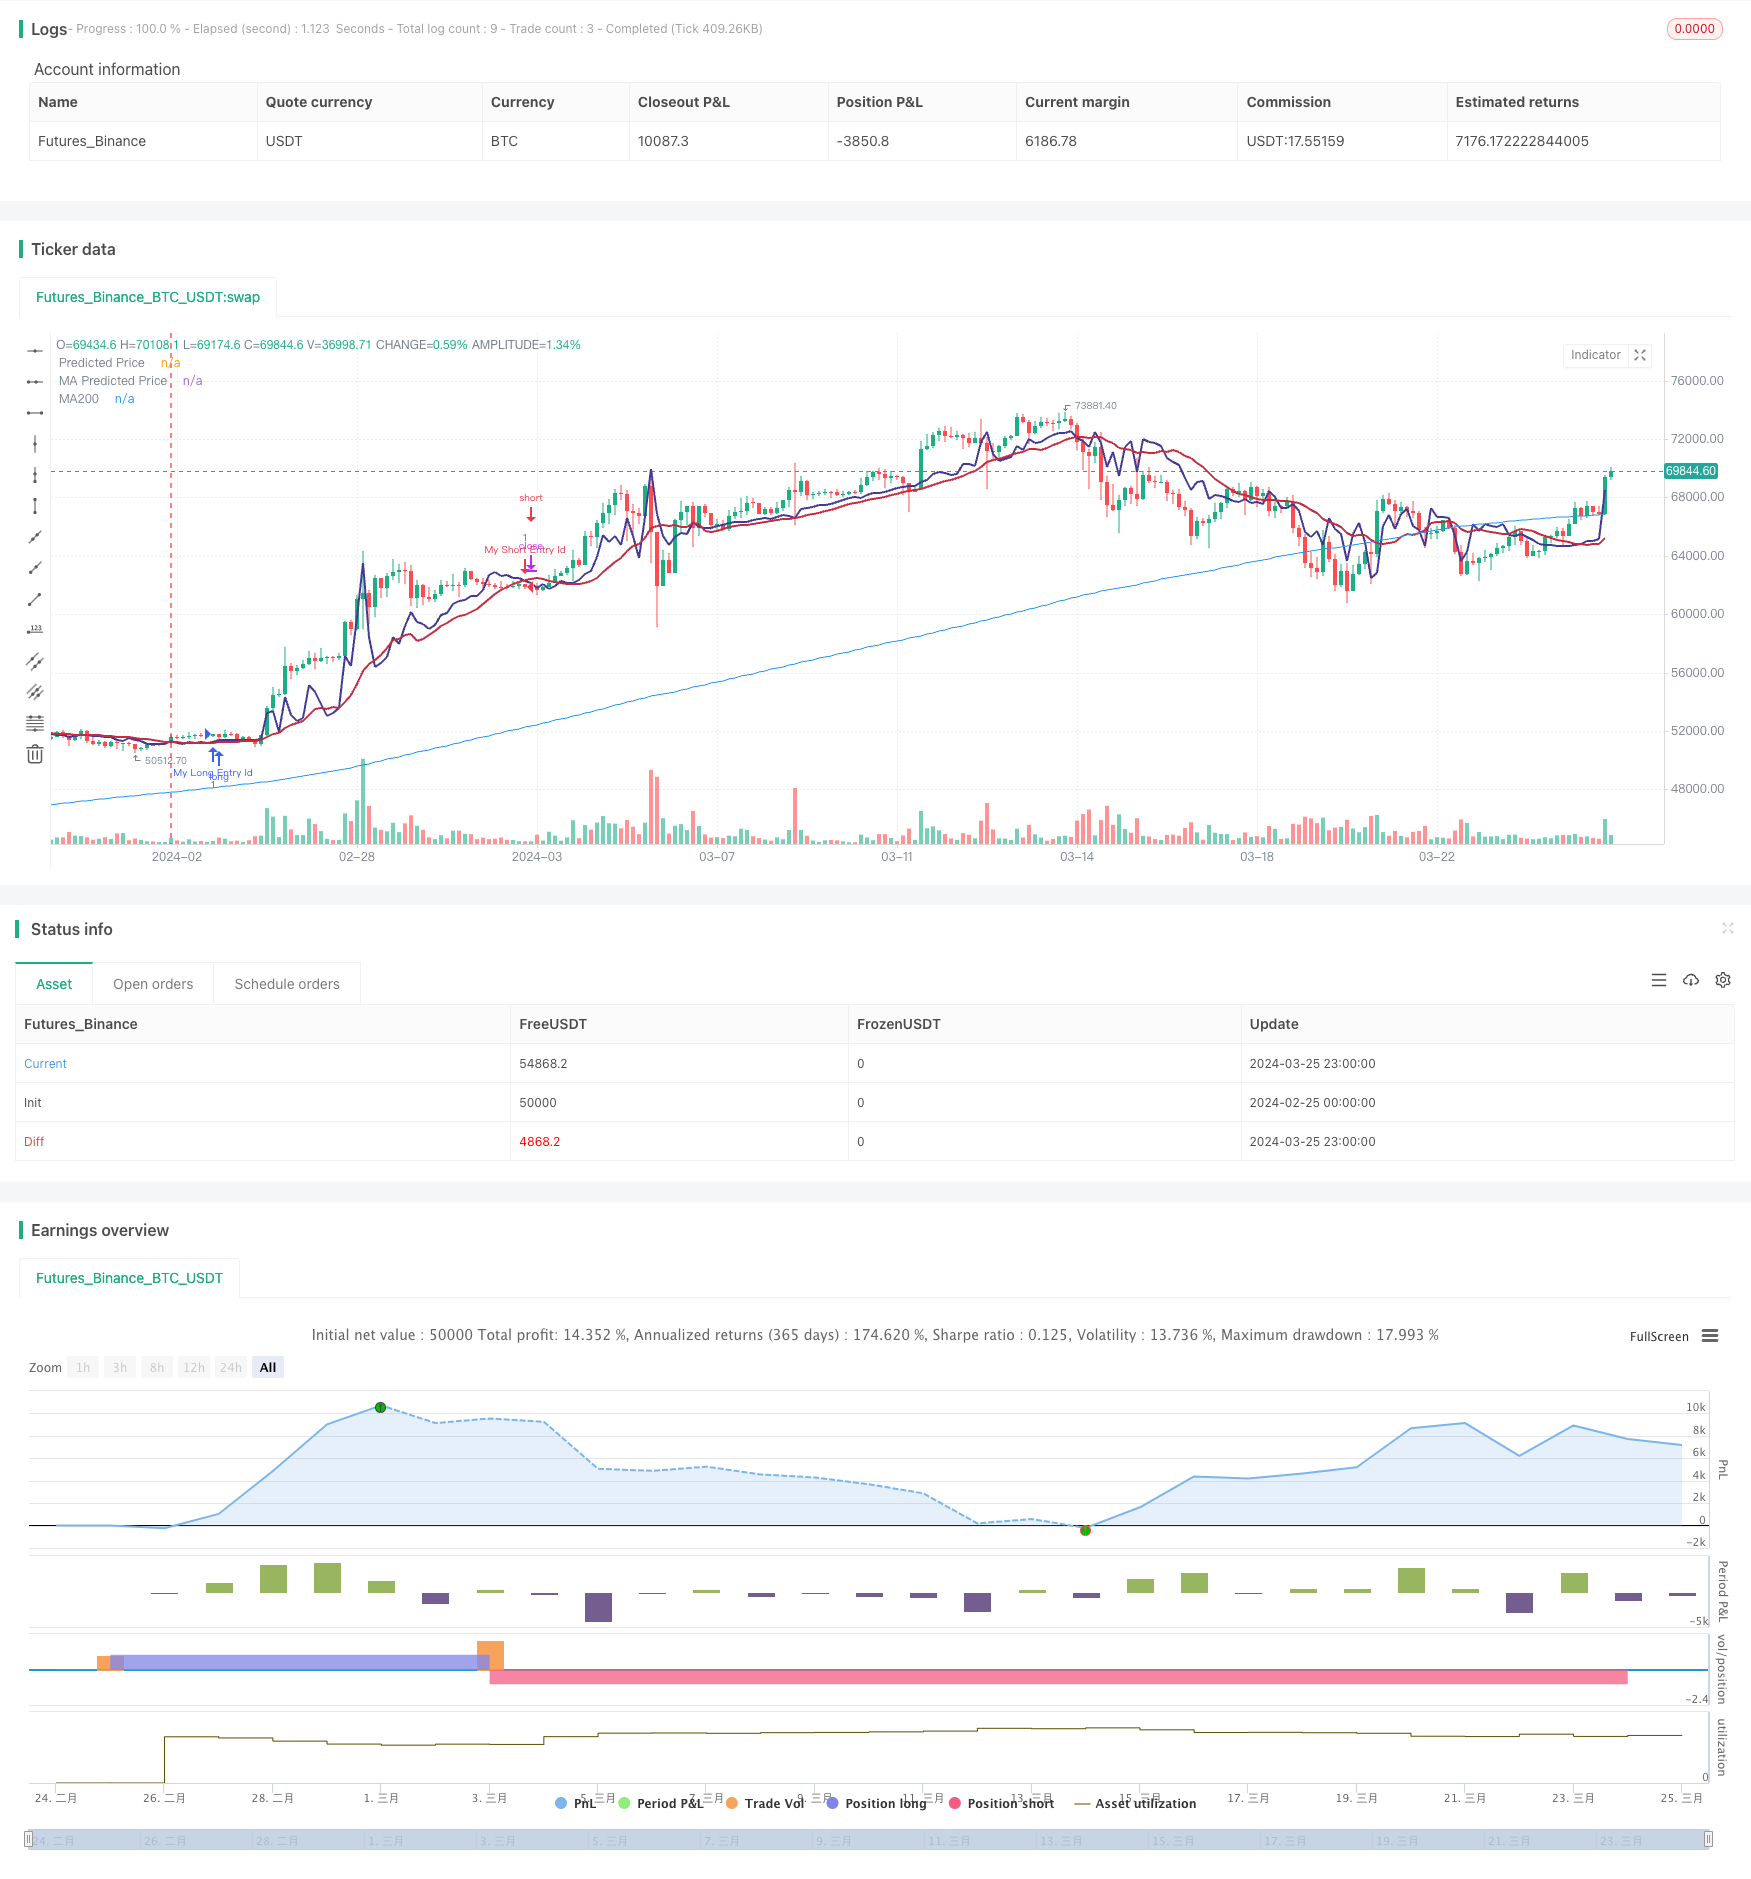
মাল্টি-হোস্ট লিনিয়ার ক্রস কৌশল একটি প্রযুক্তিগত বিশ্লেষণ কৌশল যা একটি লিনিয়ার রিগ্রেশন মডেলের উপর ভিত্তি করে শেয়ারের ভবিষ্যতের দামের গতিবিধি পূর্বাভাস দেয়। কৌশলটির মূল নীতিটি হ’লঃ শেয়ারের দামের গতিবিধি প্রায়শই একটি নির্দিষ্ট লিনিয়ার প্রবণতা অনুসরণ করে এবং দামের লিনিয়ার রিগ্রেশন গণনা করে ভবিষ্যতের দামের পূর্বাভাস দেওয়া যায়। যখন পূর্বাভাস মূল্য বর্তমান মূল্য অতিক্রম করে তখন অতিরিক্ত করে, যখন এটি অতিক্রম করে তখন সমতল।
কৌশল নীতি
এই কৌশলটি প্রথমে একটি নির্দিষ্ট সময়ের মধ্যে শেয়ারের দামের লিনিয়ার রিটার্ন গণনা করে। লিনিয়ার রিটার্নটি সর্বনিম্ন বিয়োগের সাথে একটি সরলরেখা তৈরি করে, যা সময়ের সাথে সাথে দামের পরিবর্তনের প্রবণতাকে উপস্থাপন করে। কৌশলটি তারপরে একটি চার্টে পূর্বাভাস মূল্যের লাইন এবং বর্তমান মূল্য আঁকেন।
নীতি দুটি সংকেত সংজ্ঞায়িত করেঃ
- মাল্টি সিগন্যালঃ যখন পূর্বাভাস মূল্য বর্তমান মূল্যের উপরে থাকে তখন এটি ট্রিগার হয়
- খালি সাইনঃ যখন পূর্বাভাস মূল্য বর্তমান মূল্য অতিক্রম করে তখন ট্রিগার হয়
যখন ওভার সিগন্যাল আসে, তখন পজিশন ওপেন করে ওভার করুন; যখন ড্রাইভ সিগন্যাল আসে, তখন পজিশন প্লেইন করুন।
কৌশলটির মূল পদক্ষেপগুলি হলঃ
- একটি নির্দিষ্ট সময়ের মধ্যে মূল্যের লিনিয়ার রিগ্রেশন গণনা করা
- একটি চার্টে পূর্বাভাস মূল্যের লাইন এবং বর্তমান মূল্য আঁকুন
- সংজ্ঞায়িত ওভার এবং ডাউন সিগন্যাল
- সিগন্যাল ট্রিগার হলে বেশি পজিশন খুলুন
- খালি করার সংকেত ট্রিগার করার সময় পজিশন
সামর্থ্য বিশ্লেষণ
মাল্টিফোনিয়াল লিনিয়ার ক্রসিং কৌশল নিম্নলিখিত সুবিধাগুলি নিয়ে আসেঃ
- সহজ এবং কার্যকরী: এই কৌশলটি স্পষ্ট, সহজেই বাস্তবায়িত হয় এবং মূল্যের একটি রৈখিক প্রবণতা ধরা যায়।
- প্রয়োগযোগ্যতাঃ ট্রেন্ডিং বা অস্থিরতার সময়, কৌশলগুলি ট্রেডিং সিগন্যাল তৈরি করতে পারে।
- অপ্টিমাইজযোগ্যতাঃ কৌশলটিতে কিছু মূল প্যারামিটার রয়েছে, যেমন লিনিয়ার রিটার্ন পিরিয়ড, মুভিং এভারেজ ইত্যাদি। এই প্যারামিটারগুলি অপ্টিমাইজ করে কৌশলটির কার্যকারিতা বাড়ানো যেতে পারে।
ঝুঁকি বিশ্লেষণ
মাল্টি-ফ্ল্যাশ লিনিয়ার ক্রসিং কৌশলটির অনেক সুবিধা থাকলেও, এর কিছু ঝুঁকিও রয়েছেঃ
- প্রবণতা সনাক্তকরণ ঝুঁকিঃ যখন দামের গতিপথটি একটি রৈখিক প্রবণতা অনুসরণ করে না, যেমন একটি শক, কৌশলটি ভুল সংকেত দিতে পারে। অন্যান্য সূচক যেমন এমএসিডি এবং আরও কিছু সংযুক্ত করে ঝুঁকি হ্রাস করা যেতে পারে।
- প্যারামিটার সেটিংয়ের ঝুঁকিঃ কৌশলগত কার্যকারিতা প্যারামিটার সেটিংয়ের জন্য সংবেদনশীল, ভুল প্যারামিটারগুলি ক্ষতির কারণ হতে পারে। তাই রিয়েল-টাইমে যাওয়ার আগে প্যারামিটারগুলির যথাযথ পুনরায় পরীক্ষা এবং অপ্টিমাইজেশন করা দরকার।
- ওভারফিট হওয়ার ঝুঁকিঃ যদি প্যারামিটারগুলিকে অতিরিক্ত অপ্টিমাইজ করা হয় তবে কৌশলগুলি অতীতের ডেটা ওভারফিট করতে পারে এবং ভবিষ্যতে দুর্বল পারফরম্যান্স করতে পারে। ওভারফিট এড়ানোর উপায়গুলির মধ্যে রয়েছে সরল রাখা, ডেটা সেটের বাইরে পরীক্ষা করা ইত্যাদি।
অপ্টিমাইজেশান দিক
- অন্যান্য সূচকগুলির সাথে সংযুক্তঃ লাইনরি রিগ্রেশন সংকেতগুলি অন্যান্য প্রযুক্তিগত সূচকগুলির সাথে সংযুক্ত করা যেতে পারে যেমন এমএসিডি, ব্রিন ব্যান্ড ইত্যাদি, যা সংকেতের নির্ভুলতা বাড়ায়।
- গতিশীল প্যারামিটার অপ্টিমাইজেশানঃ একটি প্যারামিটার স্ব-অনুকূলিতকরণ ব্যবস্থা ডিজাইন করা যেতে পারে, যা বাজারের অবস্থার উপর নির্ভর করে প্যারামিটারগুলিকে গতিশীলভাবে সামঞ্জস্য করে এবং অভিযোজনযোগ্যতা বাড়ায়।
- ঝুঁকি নিয়ন্ত্রণ মডিউল যোগ করুনঃ কৌশলটিতে স্টপ লস, তহবিল পরিচালনার মতো ঝুঁকি নিয়ন্ত্রণ ব্যবস্থা অন্তর্ভুক্ত করুন, একক লেনদেনের ঝুঁকি হ্রাস করুন এবং ক্রমবর্ধমান আয় বাড়ান।
- মেশিন লার্নিং অপ্টিমাইজেশানঃ মেশিন লার্নিং অ্যালগরিদমের সাহায্যে লিনিয়ার রিগ্রেশন মডেলকে ক্রমাগত অপ্টিমাইজ করা যায় যাতে এর পূর্বাভাস আরও সঠিক হয়।
সারসংক্ষেপ
মাল্টি-হোলি লিনিয়ার ক্রস কৌশলটি মূল্যের লিনিয়ার রিগ্রেশন ভিত্তিক, দাম এবং বর্তমান মূল্যের তুলনা করে ট্রেডিং সংকেত উত্পন্ন করে। এই কৌশলটির যুক্তিটি সহজ এবং পরিষ্কার, দামের লিনিয়ার প্রবণতা ক্যাপচার করতে পারে, এটি বিভিন্ন ধরণের পরিস্থিতিতে প্রযোজ্য। একই সাথে, কৌশলটি বাস্তবায়ন এবং অপ্টিমাইজ করা সহজ, প্যারামিটারগুলিকে নমনীয়ভাবে সামঞ্জস্য করা যায়, অন্যান্য সূচকগুলির সাথে মিলিত করা যায়, ঝুঁকি নিয়ন্ত্রণ মডিউল ইত্যাদি যুক্ত করা যায়, কৌশলটির কার্যকারিতা ক্রমাগত উন্নত করা যায়। তবে কৌশলটি ট্রেন্ড সনাক্তকরণের অযৌক্তিকতা, প্যারামিটার সেট আপ করা, ইতিহাসের ডেটা ঝুঁকিগুলিকে অতিরিক্ত অনুকরণ করা ইত্যাদির সাথে জড়িত।
/*backtest
start: 2024-02-25 00:00:00
end: 2024-03-26 00:00:00
period: 3h
basePeriod: 15m
exchanges: [{"eid":"Futures_Binance","currency":"BTC_USDT"}]
*/

// This source code is subject to the terms of the Mozilla Public License 2.0 at https://mozilla.org/MPL/2.0/
// © stocktechbot
//@version=5
strategy("Linear Cross", overlay=true, margin_long=100, margin_short=0)

//Linear Regression

vol = volume

// Function to calculate linear regression
linregs(y, x, len) =>
    ybar = math.sum(y, len)/len
    xbar = math.sum(x, len)/len
    b = math.sum((x - xbar)*(y - ybar),len)/math.sum((x - xbar)*(x - xbar),len)
    a = ybar - b*xbar
    [a, b]

// Historical stock price data
price = close

// Length of linear regression
len = input(defval = 21, title = 'Strategy Length')
linearlen=input(defval = 9, title = 'Linear Lookback')
[a, b] = linregs(price, vol, len)

// Calculate linear regression for stock price based on volume
//eps = request.earnings(syminfo.ticker, earnings.actual)
//MA For double confirmation

out = ta.sma(close, 200)
outf = ta.sma(close, 50)
outn = ta.sma(close, 90)
outt = ta.sma(close, 21)
outthree = ta.sma(close, 9)

// Predicted stock price based on volume
predicted_price = a + b*vol

// Check if predicted price is between open and close
is_between = open < predicted_price and predicted_price < close

//MACD
//[macdLine, signalLine, histLine] = ta.macd(close, 12, 26, 9)

// Plot predicted stock price
plot(predicted_price, color=color.rgb(65, 59, 150), linewidth=2, title="Predicted Price")
plot(ta.sma(predicted_price,linearlen), color=color.rgb(199, 43, 64), linewidth=2, title="MA Predicted Price")
//offset = input.int(title="Offset", defval=0, minval=-500, maxval=500)
plot(out, color=color.blue, title="MA200")
[macdLine, signalLine, histLine] = ta.macd(predicted_price, 12, 26, 9)

//BUY Signal

longCondition=false
mafentry =ta.sma(close, 50) > ta.sma(close, 90)
//matentry = ta.sma(close, 21) > ta.sma(close, 50)
matwohun = close > ta.sma(close, 200)
twohunraise = ta.rising(out, 2)
twentyrise = ta.rising(outt, 2)
macdrise = ta.rising(macdLine,2)
macdlong = ta.crossover(predicted_price, ta.wma(predicted_price,linearlen))  and (signalLine < macdLine)
if macdlong and macdrise
    longCondition := true

if (longCondition)
    strategy.entry("My Long Entry Id", strategy.long)
//Sell Signal
lastEntryPrice = strategy.opentrades.entry_price(strategy.opentrades - 1)
daysSinceEntry = len
daysSinceEntry := int((time - strategy.opentrades.entry_time(strategy.opentrades - 1)) / (24 * 60 * 60 * 1000))
percentageChange = (close - lastEntryPrice) / lastEntryPrice * 100
//trailChange = (ta.highest(close,daysSinceEntry) - close) / close * 100

//label.new(bar_index, high, color=color.black, textcolor=color.white,text=str.tostring(int(trailChange)))
shortCondition=false
mafexit =ta.sma(close, 50) < ta.sma(close, 90)
matexit = ta.sma(close, 21) < ta.sma(close, 50)
matwohund = close < ta.sma(close, 200)
twohunfall = ta.falling(out, 3)
twentyfall = ta.falling(outt, 2)
shortmafall = ta.falling(outthree, 1)
macdfall = ta.falling(macdLine,1)
macdsell = macdLine < signalLine
if macdfall and macdsell and (macdLine < signalLine) and ta.falling(low,2)
    shortCondition := true

if (shortCondition)
    strategy.entry("My Short Entry Id", strategy.short)