RSI von zdmre
Schriftsteller:ChaoZhang, Datum: 2022-05-13 16:34:43Tags:RMA
Traditionelle Interpretationen und Verwendung des RSI diktieren, dass Werte von 70 oder mehr darauf hindeuten, dass ein Wertpapier überkauft oder überbewertet wird und für eine Trendumkehr oder einen Korrekturpreisrückgang vorbereitet sein kann.
30 = Überverkauf 70 = Überkauft
Danke @DieGobelMonte für deinen Vorschlag.
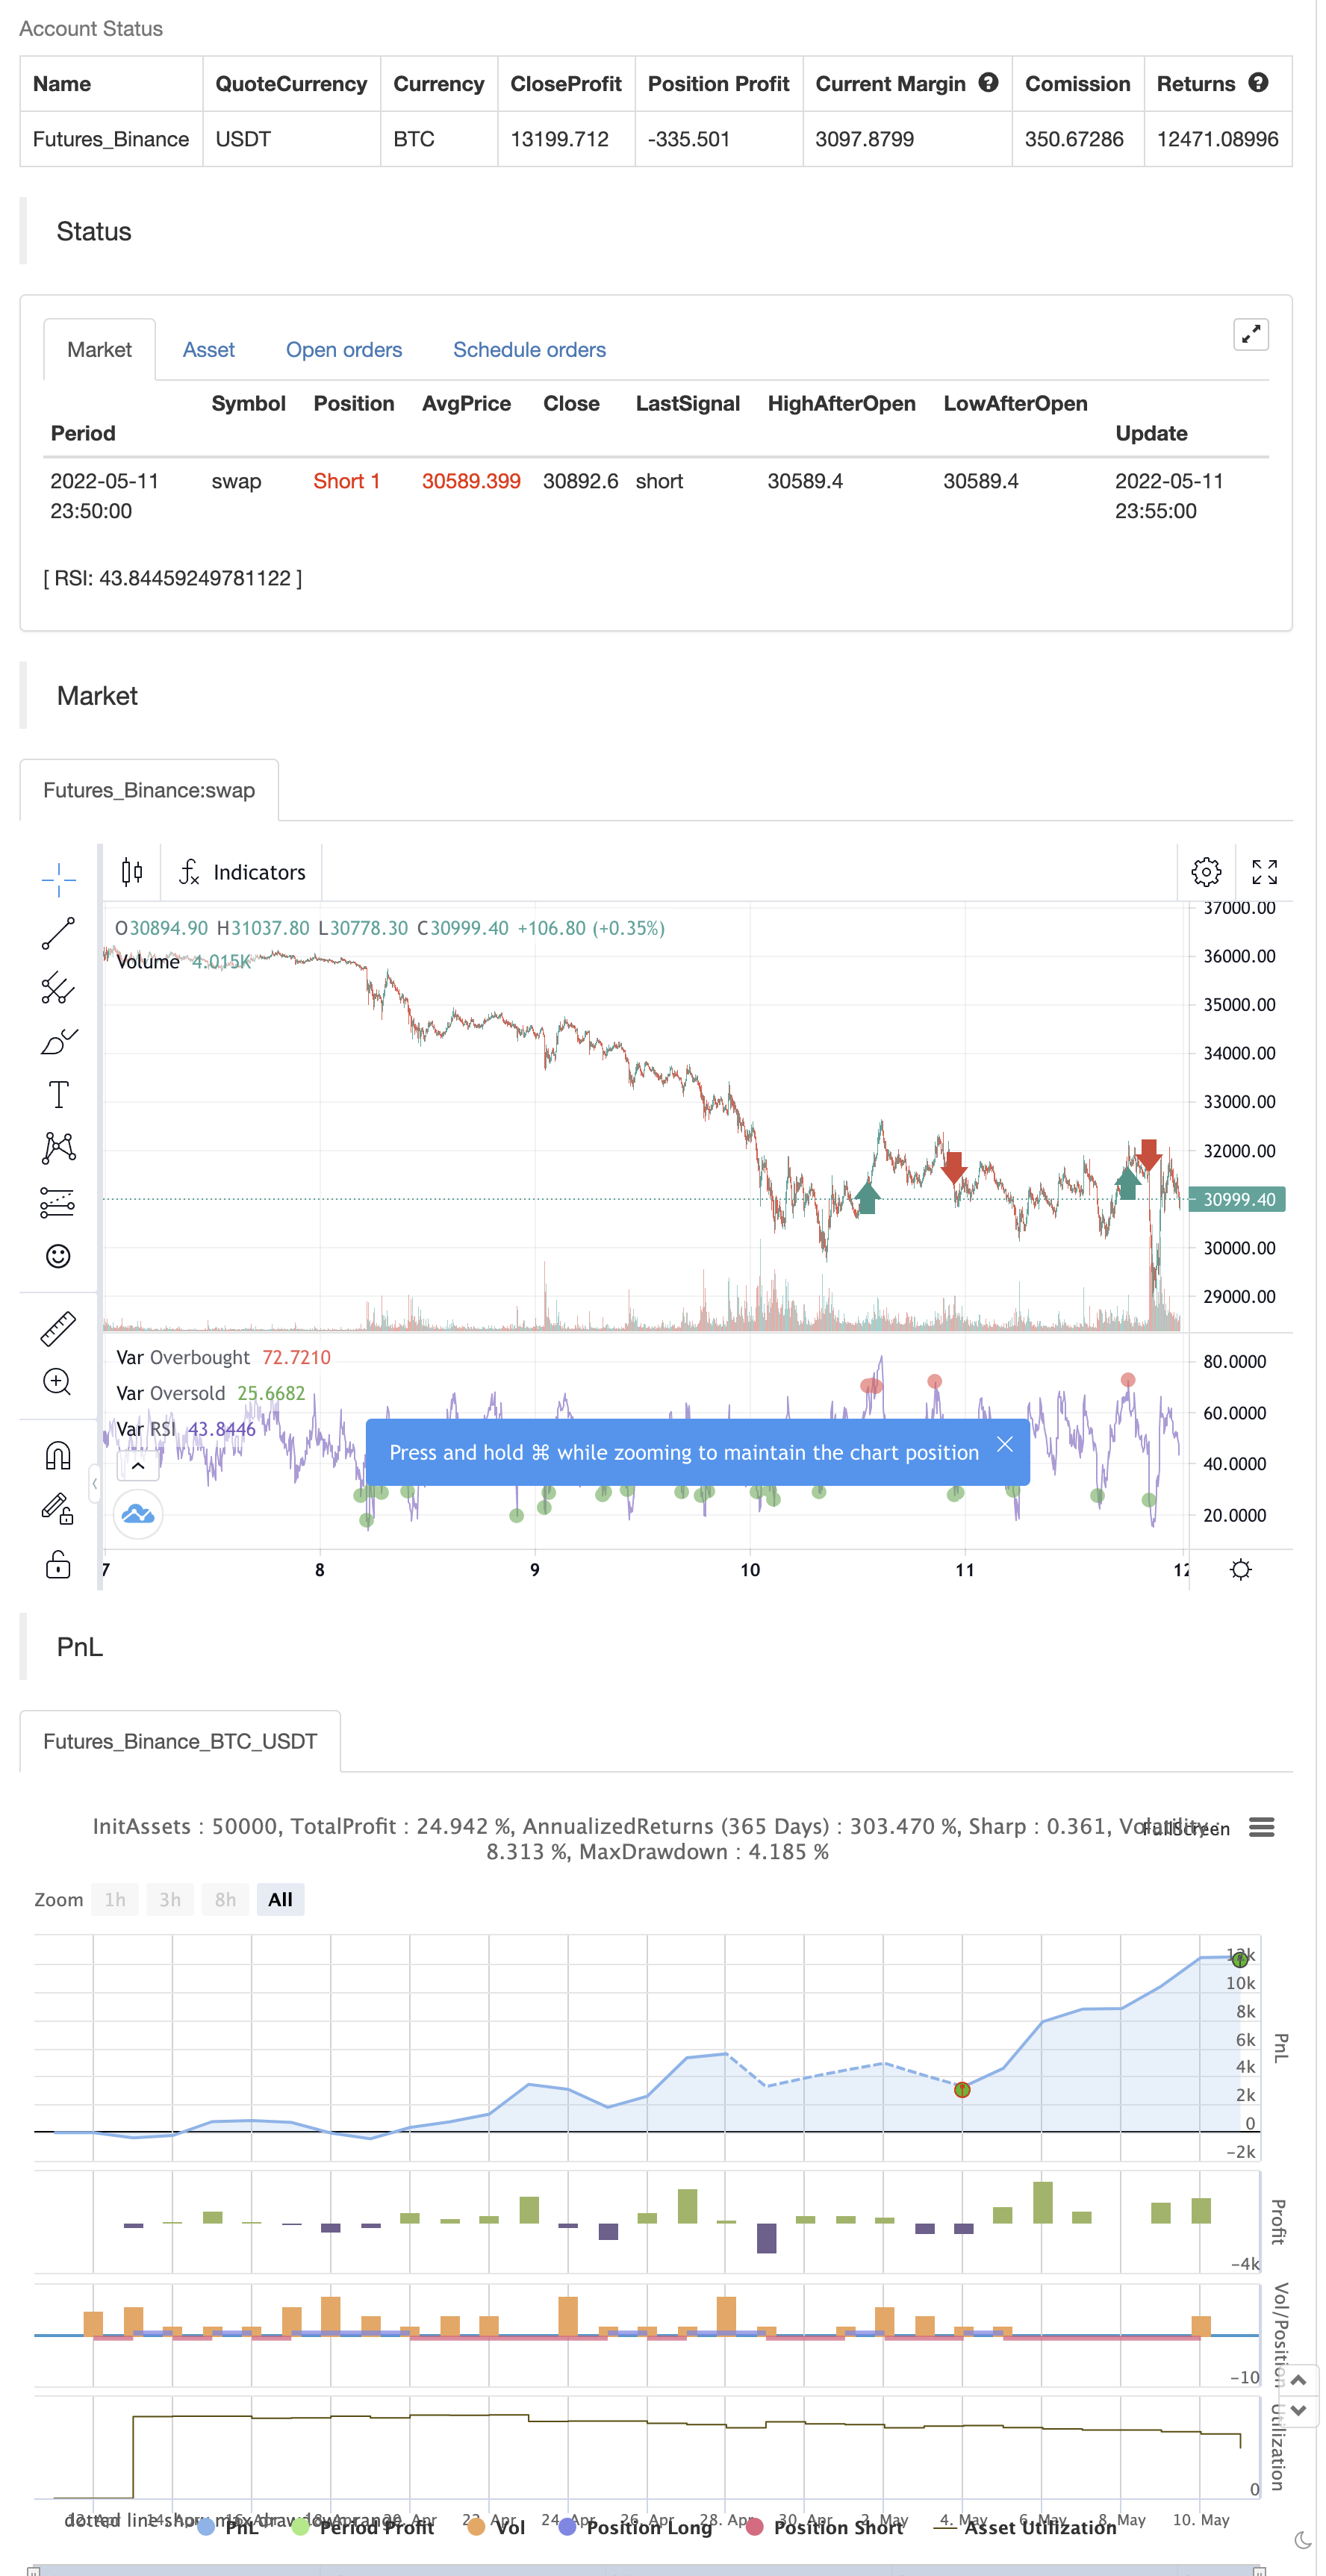
Zurückprüfung
/*backtest
start: 2022-04-12 00:00:00
end: 2022-05-11 23:59:00
period: 5m
basePeriod: 1m
exchanges: [{"eid":"Futures_Binance","currency":"BTC_USDT"}]
*/

// This source code is subject to the terms of the Mozilla Public License 2.0 at https://mozilla.org/MPL/2.0/
// © zdmre

//@version=5
indicator("RSI by zdmre", overlay=false)

len = input.int(14, minval=1, title='Length')
src = input(close, 'Source')
up = ta.rma(math.max(ta.change(src), 0), len)
down = ta.rma(-math.min(ta.change(src), 0), len)
rsi = down == 0 ? 100 : up == 0 ? 0 : 100 - 100 / (1 + up / down)
plot(rsi, 'RSI', color=color.new(#7E57C2, 0))
band1 = hline(70, "Upper Band", color=#787B86)
bandm = hline(50, "Middle Band", color=color.new(#787B86, 50))
band0 = hline(30, "Lower Band", color=#787B86)
fill(band1, band0, color=color.rgb(126, 87, 194, 90), title="Background")

ob= ta.cross(rsi, 70) == 1 and rsi >= 70
os = ta.cross(rsi, 30) == 1 and rsi <= 30

plot(ob ? rsi : na ,title='Overbought', style=plot.style_circles, color=color.new(color.red, 0), linewidth=5)
plot(os ? rsi : na ,title='Oversold ', style=plot.style_circles, color=color.new(color.green, 0), linewidth=5)

if ob
    strategy.entry("Enter Long", strategy.long)
else if os
    strategy.entry("Enter Short", strategy.short)
Verwandt
- Fibonacci-Trendumkehrstrategie
- VWMA-ADX Momentum und trendbasierte Bitcoin Long Strategie
- Scalping EMA ADX RSI mit Kauf/Verkauf
- FTSMA - Trend ist dein Freund
- Eine makellose Siegstrategie
- BESTE Verschlucken + Ausbruchstrategie
- Super Scalper - 5 Minuten 15 Minuten
- Superjump-Rückschritt Bollinger-Band
- Fukuiz-Trend
- SSL-Hybrid
- Momentum-basierte ZigZag
Mehr
- - Ich weiß.
- Drehpunkte Hoch-Niedrig-Multi-Zeitrahmen
- Geistertrends verfolgen Strategiedatenbanken
- Geistertrends verfolgen Strategien für die Geschäftsbank
- Geistertrend-Verfolgungsstrategien
- Regenbogen-Oszillator
- Beispiel für die Größe der Aktienkurvenposition
- KLineChart-Demo
- Villa Dynamic Pivot Supertrend-Strategie
- Crodls Supertrend
- FTL - Bereichsfilter X2 + EMA + UO
- BRAHMASTRA
- Mobo-Bänder
- SAR + 3SMMA mit SL & TP
- SSS
- Vorlage für Warnmeldungen für den Mondstart [Indikator]
- HALFTREND + HEMA + SMA (Falschsignal-Strategie)
- RSI Divergenz mit Pivot, BB, SMA, EMA, SMMA, WMA, VWMA
- RSI und BB und gleichzeitig Überverkauft
- Rollende Heikin Ashi Kerzen