Trendfolgende Vier-Elemente-Strategie


Erstellungsdatum: 2023-10-17 14:47:00 zuletzt geändert: 2023-10-17 14:47:00
Kopie: 0 Klicks: 603
1
konzentrieren Sie sich auf
1617
Anhänger

Trendfolgende Vier-Elemente-Strategie

Überblick

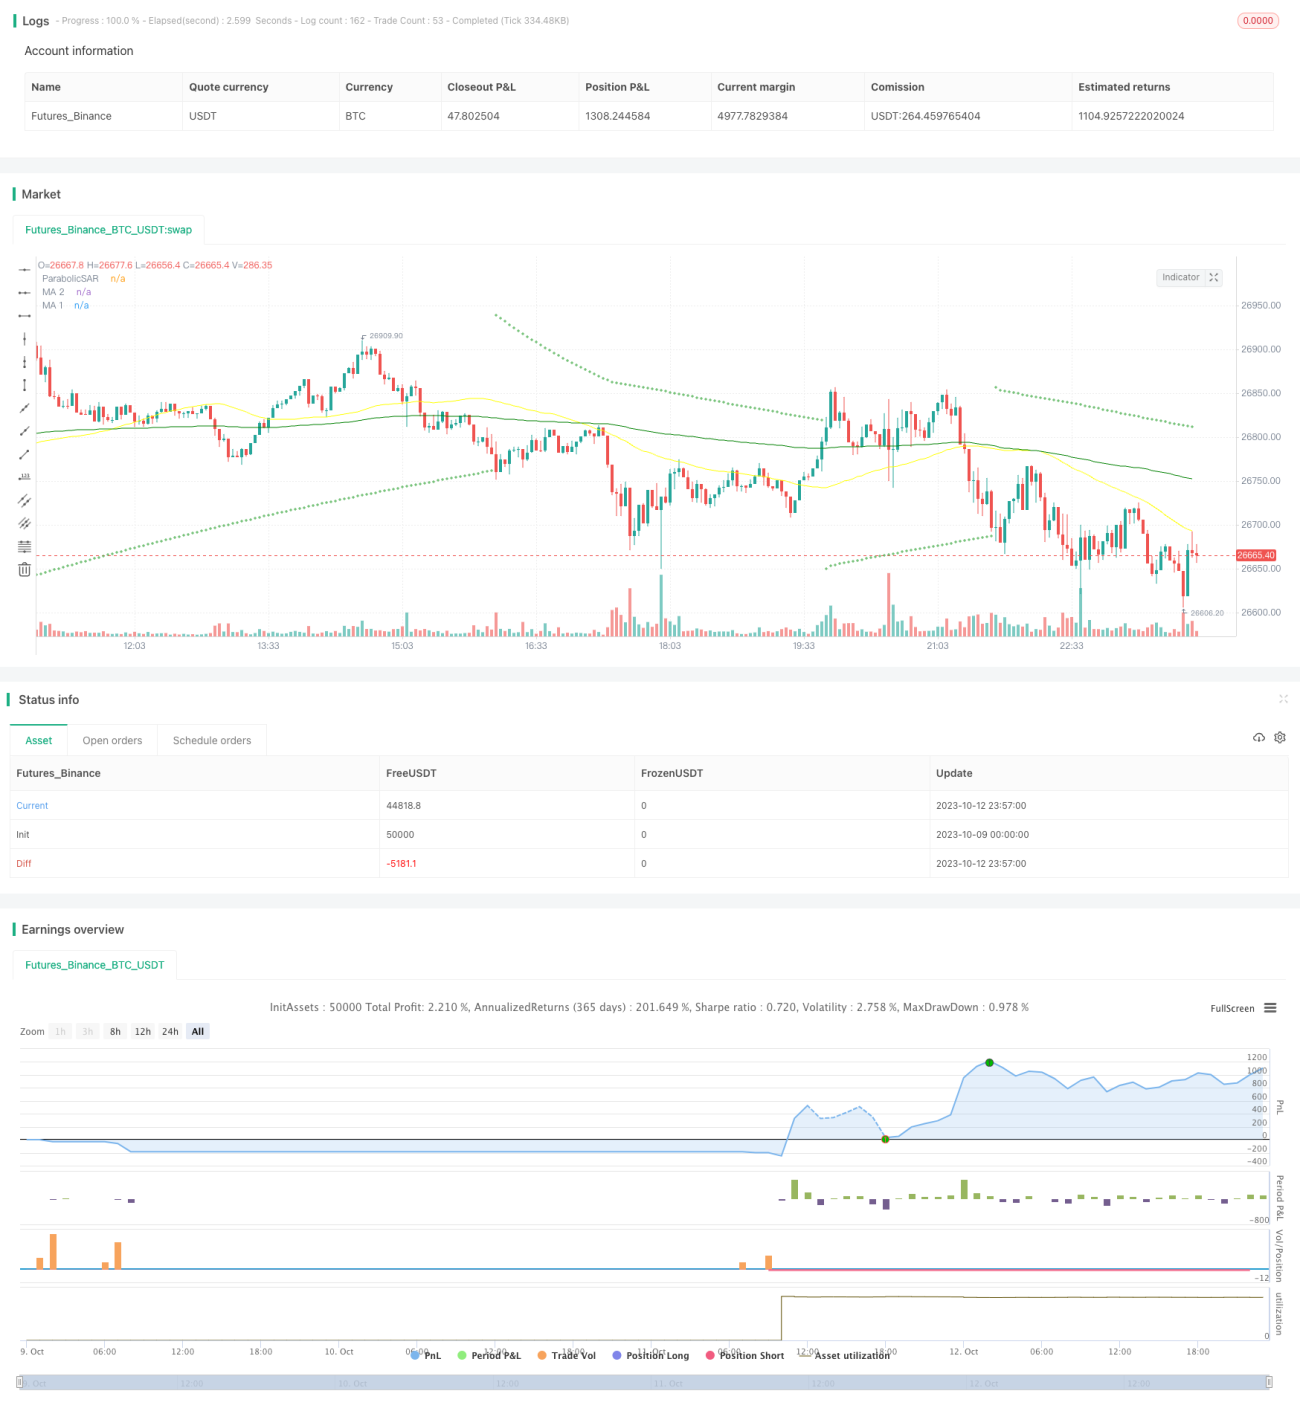
Die Strategie verwendet die vier Elemente Sar, Rsi, Vol und Ma-Gleichgewicht zur Identifizierung von Trends und nutzt robuste Risikomanagement-Maßnahmen, um Trends zu verfolgen und zu profitieren. Die Strategie basiert auf dem Sar-Indikator, unterstützt durch rsi Überkauf-Überverkauf-Begrenzung zur Identifizierung von Umkehrsignalen, der Vol-Indikator wird als Transaktionsmerkmal beurteilt, und die Ma-Gleichgewicht-Linie beurteilt die Richtung des Haupttrends.

Strategieprinzip

Die Strategie basiert auf vier wichtigen technischen Indikatoren:

  1. Parabolic SAR: Der Indikator nutzt die Beziehung zwischen den Punkten und dem Trend, um die Trendrichtung und die Wendepunkte zu bestimmen. Die Punkte sind positiv, wenn der Preis oben ist, und die Punkte sind negativ, wenn der Preis unten ist.

  2. RSI: Relativ starker Indikator. Der Indikator beurteilt die Überkauf-Überverkaufssituation der Märkte mit Schwankungen zwischen 0 und 100. Ein RSI über 70 ist eine Überkaufzone, ein RSI unter 30 ist eine Überverkaufszone und ein Rückgang in die Mitte der Mitte um 50 ist eine Mittellinie.

  3. VOL: Traffic Volume Indicator. Die Strategie nutzt VOL, um die Traffic Volume-Verstärkung zu bestimmen, um Trends zu bestätigen und die Qualität des Umkehrsignals zu beurteilen.

  4. MA: Moving Average. Die Strategie nutzt die langen und kurzen Durchschnittslinien, um die Richtung des Haupttrends zu bestimmen. Über die kurzen Durchschnittslinien ist das Plussignal, unter der kurzen Durchschnittslinie ist das Negativsignal.

Regeln für die Generierung von Handelssignalen:

Mehrköpfige Bedingungen: SAR-Punkt unterhalb der K-Linie und RSI von unten nach oben in die Mittellinie, VOL-Vergrößerung deutlich, kurze Mittellinie von unten nach oben durch die lange Mittellinie.

Hoher Zustand: Der SAR-Punkt bewegt sich über die K-Linie und der RSI fällt von oben nach unten in die Mittellinie, die VOL-Vergrößerung ist deutlich, die kurze Mittellinie durchquert die lange Mittellinie von oben nach unten.

Die Strategie enthält auch eine Stop-Loss-Risiko-Management-Regel. Die Stop-Loss-Ziel ist das 2-fache des Einstiegspreises und der Stop-Loss-Preis das 0,8-fache des Einstiegspreises, um die Gewinne effektiv zu sperren und das Risiko zu kontrollieren.

Analyse der Stärken

Diese Strategie hat folgende Vorteile:

  1. Die Multi-Indicator-Kombination wurde so konzipiert, dass falsche Signale vermieden werden, um eine echte Trendwende zu erfassen.

  2. Risikomanagement-Einstellungen zum Verlust-Stopp, um Risiken effektiv zu kontrollieren.

  3. Das Management der Positionen erlaubt es den Spielern, in Gruppen ein- und auszutreten, um ihre Gewinne zu maximieren.

  4. Die Parameter wurden durch wiederholte Optimierungstests stabilisiert.

  5. Die Daten sind ausreichend, um das reale Handelsumfeld zu simulieren.

  6. Die Logik ist klar und einfach, die Implementierung ist leicht zu verstehen.

Risikoanalyse

Die Gefahren dieser Strategie sind:

  1. Unregelmäßige Marktschwankungen führten dazu, dass die Stop-Loss-Distanz durchbrochen wurde.

  2. Unzureichende Liquidität der Transaktionsvarianten führt zu unhaltbaren Verlusten. Die Transaktionsvarianten mit guter Liquidität sollten gewählt werden.

  3. Systemische Risiken führen zu außergewöhnlichen Sprüngen. Leverage sollte reduziert werden und Anlagen mit einer guten Wertebasierung gehalten werden.

  4. Überoptimierung der Parameter führt zu einer zu schönen Kurve. Die Parameter sollten entsprechend abgeschwächt werden, um die Stabilität zu verbessern.

  5. Die Slip-Point-Kosten, die durch eine zu hohe Handelsfrequenz entstehen. Die Intervalle für die Erzeugung von Handelssignalen können angemessen gelockert werden.

  6. Die Signalwirkung wird schwächer und muss zeitnah aktualisiert werden. Die Parameter sollten regelmäßig überprüft und optimiert werden.

Optimierungsrichtung

Die Strategie kann in folgenden Bereichen weiter optimiert werden:

  1. Test mehr Kombinationen von Indikatoren, wie MACD, KD und so weiter, um bessere Übereinstimmungen zu finden.

  2. Optimierte MA-Zyklus-Parameter-Einstellungen, um den Haupttrend deutlicher zu erkennen.

  3. Optimierung des Stop-Loss-Faktors, um das beste Risiko-Gewinn-Verhältnis zu erzielen.

  4. Tests zur Stärke verschiedener Variantenparameter und Suche nach der optimalen Kombination.

  5. Die Einführung von maschinellen Lernmodellen zur Unterstützung der Bewertung von Handelssignalen.

  6. Die Anpassung von Stop-Loss-Algorithmen, um die Stop-Loss-Algorithmen näher an die realen Schwankungen zu bringen.

  7. Die Parameter für einen längeren Testzyklus sind festgelegt, um den Stoppbereich zu erweitern.

Zusammenfassen

Die Strategie verwendet mehrere Indikatoren, um falsche Signale zu filtern, um die Richtung des Trends zu bestimmen, Stop-Loss-Stopp-Maßnahmen zu erstellen und die Risiken zu kontrollieren, um die Strategiewirksamkeit durch Parameteroptimierung und Portfolioanpassung kontinuierlich zu verbessern. Obwohl keine Strategie die Zukunft perfekt vorhersagen kann, erhöht die Gewinnwahrscheinlichkeit erheblich durch eine gute Risikomanagement in Kombination mit einer systematischen Handelsplanung.

Strategiequellcode
/*backtest
start: 2023-10-09 00:00:00
end: 2023-10-13 00:00:00
period: 3m
basePeriod: 1m
exchanges: [{"eid":"Futures_Binance","currency":"BTC_USDT"}]
*/

// This source code is subject to the terms of the Mozilla Public License 2.0 at https://mozilla.org/MPL/2.0/
// © myn

//@version=5
strategy('Strategy Myth-Busting #6 - PSAR+MA+SQZMOM+HVI - [MYN]', max_bars_back=5000, overlay=true, pyramiding=0, initial_capital=20000, currency='USD', default_qty_type=strategy.percent_of_equity, default_qty_value=100.0, commission_value=0.075, use_bar_magnifier = false)


/////////////////////////////////////
//* Put your strategy logic below *//
/////////////////////////////////////
// dOg28adjYWY


//Trading Strategies Used
// Parabolic Sar
// 10 in 1 MA's
// Squeeze Momentum
// HawkEYE Volume Indicator

// Long Condition
// Parabolic Sar shift below price at last dot above and then previous bar needs to breach above that.
// Price action has to be below both MA's and 50MA needs to be above 200MA
// Squeeze Momentum needsd to be in green or close to going green
// HawkEYE Volume Indicator needs to be show a green bar on the histagram

// Short Condition
// Parabolic Sar shift above price at last dot below and then previous bar needs to breach below that.
// Price action needs to be above both MA's and 50MA needs to be below 200MA
// Squeeze Momentum needsd to be in red or close to going red
// HawkEYE Volume Indicator needs to be show a red bar on the histagram


// Parabolic SAR
//░░░░░░░░░░░░░░░░░░░░░░░░░░░░░░░░░░░░░░░░░░░░░░░░░░░░░░░░░░░░░░░░░░░░░░░░░░░░░░░░░░░░░░░░░░░░░░░░░░░░░░░░░░░░░░░░░░░░░░░░░░░░░░░░░░░░░░░░░░░░░░░░░░


//@version=5
//indicator(title="Parabolic SAR", shorttitle="SAR", overlay=true, timeframe="", timeframe_gaps=true)
// Dynamic Max based on trendcode
int TrendCodeAdaptive = switch timeframe.multiplier
    1 => 1
    3 => 1
    5 => 1
    10 => 2
    15 => 3
    30 => 5
    45 => 5
    60 => 7
    120 => 9
    180 => 9
    240 => 13
    300 => 14
    360 => 15
    =>
        int(4)


bool overrideAdaptiveSar = input(false, title="Override Adaptive PSAR", group="Adaptive Parabolic Sar")
TrendCodeOverRide = input(5, title='Trend Code (If Overriding Adaptive PSAR)')


startPSAR = 0.02
increment = 0.02
maximum = overrideAdaptiveSar ? TrendCodeOverRide * 0.005 :  TrendCodeAdaptive * 0.005
PSAR = ta.sar(startPSAR, increment, maximum)
plot(PSAR, "ParabolicSAR", style=plot.style_cross, color=color.green)

//PSARLongEntry = PSAR < close ? 1 : na
//PSARShortEntry = PSAR < close ? na : -1
    
PSARLongEntry = high < PSAR and barstate.isconfirmed
PSARShortEntry = low > PSAR and barstate.isconfirmed


// Squeeze Momentum
//░░░░░░░░░░░░░░░░░░░░░░░░░░░░░░░░░░░░░░░░░░░░░░░░░░░░░░░░░░░░░░░░░░░░░░░░░░░░░░░░░░░░░░░░░░░░░░░░░░░░░░░░░░░░░░░░░░░░░░░░░░░░░░░░░░░░░░░░░░░░░░░░░░

//@version=5
// @author LazyBear 
// List of all my indicators: https://www.tradingview.com/v/4IneGo8h/
//
//indicator(shorttitle='SQZMOM_LB', title='Squeeze Momentum Indicator [LazyBear]', overlay=false)

lengthBB = input(20, title='BB Length', group="Squeeze Momentum")
mult = input(2.0, title='BB MultFactor')
lengthKC = input(20, title='KC Length')
multKC = input(1.5, title='KC MultFactor')

useTrueRange = input(true, title='Use TrueRange (KC)')

// Calculate BB
source = close
basis = ta.sma(source, lengthBB)
dev = multKC * ta.stdev(source, lengthBB)
upperBB = basis + dev
lowerBB = basis - dev

// Calculate KC
ma = ta.sma(source, lengthKC)
range_1 = useTrueRange ? ta.tr : high - low
rangema = ta.sma(range_1, lengthKC)
upperKC = ma + rangema * multKC
lowerKC = ma - rangema * multKC

sqzOn = lowerBB > lowerKC and upperBB < upperKC
sqzOff = lowerBB < lowerKC and upperBB > upperKC
noSqz = sqzOn == false and sqzOff == false

val = ta.linreg(source - math.avg(math.avg(ta.highest(high, lengthKC), ta.lowest(low, lengthKC)), ta.sma(close, lengthKC)), lengthKC, 0)

iff_1 = val > nz(val[1]) ? color.lime : color.green
iff_2 = val < nz(val[1]) ? color.red : color.maroon
bcolor = val > 0 ? iff_1 : iff_2
scolor = noSqz ? color.blue : sqzOn ? color.black : color.gray
//plot(val, color=bcolor, style=plot.style_histogram, linewidth=4)
//plot(0, color=scolor, style=plot.style_cross, linewidth=2)

SQZMOMLongEntry = val > 0
SQZMOMShortEntry = val < 0


// 10 in 1 Different Moving Averages
//░░░░░░░░░░░░░░░░░░░░░░░░░░░░░░░░░░░░░░░░░░░░░░░░░░░░░░░░░░░░░░░░░░░░░░░░░░░░░░░░░░░░░░░░░░░░░░░░░░░░░░░░░░░░░░░░░░░░░░░░░░░░░░░░░░░░░░░░░░░░░░░░░░

// © hiimannshu
//@version=5

// This indicator is just a simple indicator which plot any kind of multiple (atmost 10) moving everage (sma/ema/wma/rma/hma/vwma) on chart.
// Enjoy the new update

//indicator(title='10 in 1 Different Moving Averages ( SMA/EMA/WMA/RMA/HMA/VWMA )', shorttitle=' 10 in 1 MAs', overlay=true)

bool plot_ma_1 = input.bool(true, '', inline='MA 1',group= "Multi Timeframe Moving Averages")
string ma_1_type = input.string(defval='EMA', title='MA 1', options=['RMA', 'SMA', 'EMA', 'WMA','HMA','VWMA'], inline='MA 1',group= "Multi Timeframe Moving Averages")
int ma_1_val = input.int(200, '', minval=1, inline='MA 1',group= "Multi Timeframe Moving Averages")
ma1_tf = input.timeframe(title='', defval='', inline='MA 1',group= "Multi Timeframe Moving Averages")
color ma_1_colour = input.color(color.green, '', inline='MA 1',group= "Multi Timeframe Moving Averages")


bool plot_ma_2 = input.bool(true, '', inline='MA 2',group= "Multi Timeframe Moving Averages")
string ma_2_type = input.string(defval='SMA', title='MA 2 ', options=['RMA', 'SMA', 'EMA', 'WMA','HMA','VWMA'], inline='MA 2',group= "Multi Timeframe Moving Averages")
int ma_2_val = input.int(50, '', minval=1, inline='MA 2',group= "Multi Timeframe Moving Averages")
ma2_tf = input.timeframe(title='', defval='', inline='MA 2',group= "Multi Timeframe Moving Averages")
color ma_2_colour = input.color(color.yellow, '', inline='MA 2',group= "Multi Timeframe Moving Averages")


bool plot_ma_3 = input.bool(false, '', inline='MA 3',group= "Multi Timeframe Moving Averages")
string ma_3_type = input.string(defval='SMA', title='MA 3 ', options=['RMA', 'SMA', 'EMA', 'WMA','HMA','VWMA'], inline='MA 3',group= "Multi Timeframe Moving Averages")
int ma_3_val = input.int(1, '', minval=1, inline='MA 3',group= "Multi Timeframe Moving Averages")
ma3_tf = input.timeframe(title='', defval='', inline='MA 3',group= "Multi Timeframe Moving Averages")
color ma_3_colour = input.color(color.black, '', inline='MA 3',group= "Multi Timeframe Moving Averages")


bool plot_ma_4 = input.bool(false, '', inline='MA 4',group= "Multi Timeframe Moving Averages")
string ma_4_type = input.string(defval='SMA', title='MA 4 ', options=['RMA', 'SMA', 'EMA', 'WMA','HMA','VWMA'], inline='MA 4',group= "Multi Timeframe Moving Averages")
int ma_4_val = input.int(1, '', minval=1, inline='MA 4',group= "Multi Timeframe Moving Averages")
ma4_tf = input.timeframe(title='', defval='', inline='MA 4',group= "Multi Timeframe Moving Averages")
color ma_4_colour = input.color(color.black, '', inline='MA 4',group= "Multi Timeframe Moving Averages")


bool plot_ma_5 = input.bool(false, '', inline='MA 5',group= "Multi Timeframe Moving Averages")
string ma_5_type = input.string(defval='SMA', title='MA 5 ', options=['RMA', 'SMA', 'EMA', 'WMA','HMA','VWMA'], inline='MA 5',group= "Multi Timeframe Moving Averages")
int ma_5_val = input.int(1, '', minval=1, inline='MA 5',group= "Multi Timeframe Moving Averages")
ma5_tf = input.timeframe(title='', defval='', inline='MA 5',group= "Multi Timeframe Moving Averages")
color ma_5_colour = input.color(color.black, '', inline='MA 5',group= "Multi Timeframe Moving Averages")


bool plot_ma_6 = input.bool(false, '', inline='MA 6',group= "Normal Moving Averages")
string ma_6_type = input.string(defval='SMA', title='MA 6 ', options=['RMA', 'SMA', 'EMA', 'WMA','HMA','VWMA'], inline='MA 6',group= "Normal Moving Averages")
int ma_6_val = input.int(1, '', minval=1, inline='MA 6',group= "Normal Moving Averages")
ma_6_src = input.source(defval=close, title='', inline='MA 6',group= "Normal Moving Averages")
color ma_6_colour = input.color(color.black, '', inline='MA 6',group= "Normal Moving Averages")


bool plot_ma_7 = input.bool(false, '', inline='MA 7',group= "Normal Moving Averages")
string ma_7_type = input.string(defval='SMA', title='MA 7 ', options=['RMA', 'SMA', 'EMA', 'WMA','HMA','VWMA'], inline='MA 7',group= "Normal Moving Averages")
int ma_7_val = input.int(1, '', minval=1, inline='MA 7',group= "Normal Moving Averages")
ma_7_src = input.source(defval=close, title='', inline='MA 7',group= "Normal Moving Averages")
color ma_7_colour = input.color(color.black, '', inline='MA 7',group= "Normal Moving Averages")


bool plot_ma_8 = input.bool(false, '', inline='MA 8',group= "Normal Moving Averages")
string ma_8_type = input.string(defval='SMA', title='MA 8', options=['RMA', 'SMA', 'EMA', 'WMA','HMA','VWMA'], inline='MA 8',group= "Normal Moving Averages")
int ma_8_val = input.int(1, '', minval=1, inline='MA 8',group= "Normal Moving Averages")
ma_8_src = input.source(defval=close, title='', inline='MA 8',group= "Normal Moving Averages")
color ma_8_colour = input.color(color.black, '', inline='MA 8',group= "Normal Moving Averages")


bool plot_ma_9 = input.bool(false, '', inline='MA 9',group= "Normal Moving Averages")
string ma_9_type = input.string(defval='SMA', title='MA 9 ', options=['RMA', 'SMA', 'EMA', 'WMA','HMA','VWMA'], inline='MA 9',group= "Normal Moving Averages")
int ma_9_val = input.int(1, '', minval=1, inline='MA 9',group= "Normal Moving Averages")
ma_9_src = input.source(defval=close, title='', inline='MA 9',group= "Normal Moving Averages")
color ma_9_colour = input.color(color.black, '', inline='MA 9',group= "Normal Moving Averages")


bool plot_ma_10 = input.bool(false, '', inline='MA 10',group= "Normal Moving Averages")
string ma_10_type = input.string(defval='SMA', title='MA 10', options=['RMA', 'SMA', 'EMA', 'WMA','HMA','VWMA'], inline='MA 10',group= "Normal Moving Averages")
int ma_10_val = input.int(1, '', minval=1, inline='MA 10',group= "Normal Moving Averages")
ma_10_src = input.source(defval=close, title='', inline='MA 10',group= "Normal Moving Averages")
color ma_10_colour = input.color(color.black, '', inline='MA 10',group= "Normal Moving Averages")


ma_function(source, length, type) =>


    if type == 'RMA'
        ta.rma(source, length)
    else if type == 'SMA'
        ta.sma(source, length)
    else if type == 'EMA'
        ta.ema(source, length)
    else if type == 'WMA'
        ta.wma(source, length)
    else if type == 'HMA'
        if(length<2)
            ta.hma(source,2)
        else
            ta.hma(source, length)
    else 
        ta.vwma(source, length)


ma_1 = plot_ma_1 ? request.security(syminfo.tickerid, ma1_tf, ma_function(close, ma_1_val, ma_1_type)):0
ma_2 = plot_ma_2 ?request.security(syminfo.tickerid, ma2_tf, ma_function(close, ma_2_val, ma_2_type)):0
ma_3 = plot_ma_3 ?request.security(syminfo.tickerid, ma3_tf, ma_function(close, ma_3_val, ma_3_type)):0
ma_4 = plot_ma_4 ? request.security(syminfo.tickerid, ma4_tf, ma_function(close, ma_4_val, ma_4_type)):0
ma_5 = plot_ma_5 ?request.security(syminfo.tickerid, ma5_tf, ma_function(close, ma_5_val, ma_5_type)):0
ma_6 = plot_ma_6 ?ma_function(ma_6_src, ma_6_val, ma_6_type):0
ma_7 = plot_ma_7 ?ma_function(ma_7_src, ma_7_val, ma_7_type):0
ma_8 = plot_ma_8 ?ma_function(ma_8_src, ma_8_val, ma_8_type):0
ma_9 = plot_ma_9 ?ma_function(ma_9_src, ma_9_val, ma_9_type):0
ma_10 = plot_ma_10 ?ma_function(ma_10_src, ma_10_val, ma_10_type):0


plot(plot_ma_1 ? ma_1 : na, 'MA 1', ma_1_colour)
plot(plot_ma_2 ? ma_2 : na, 'MA 2', ma_2_colour)
plot(plot_ma_3 ? ma_3 : na, 'MA 3', ma_3_colour)
plot(plot_ma_4 ? ma_4 : na, 'MA 4', ma_4_colour)
plot(plot_ma_5 ? ma_5 : na, 'MA 5', ma_5_colour)
plot(plot_ma_6 ? ma_6 : na, 'MA 6', ma_6_colour)
plot(plot_ma_7 ? ma_7 : na, 'MA 7', ma_7_colour)
plot(plot_ma_8 ? ma_8 : na, 'MA 8', ma_8_colour)
plot(plot_ma_9 ? ma_9 : na, 'MA 9', ma_9_colour)
plot(plot_ma_10 ? ma_10 : na, 'MA 10', ma_10_colour)


// Long entry -  Price has to be below both MA's and 50MA needs to be above 200MA
MALongEntry = (close > ma_1 and close > ma_2) and (ma_2 > ma_1)

// Short Entry - Price has to be above both MA's and 50MA needs to be below 200MA
MAShortEntry = (close < ma_1 and close < ma_2) and (ma_2 < ma_1)


// HawkEYE Volume Indicator
//░░░░░░░░░░░░░░░░░░░░░░░░░░░░░░░░░░░░░░░░░░░░░░░░░░░░░░░░░░░░░░░░░░░░░░░░░░░░░░░░░░░░░░░░░░░░░░░░░░░░░░░░░░░░░░░░░░░░░░░░░░░░░░░░░░░░░░░░░░░░░░░░░░

//@version=5
// @author LazyBear
// If you use this code, in its original or modified form, do drop me a note. Thx. 
// 
//indicator('HawkEye Volume Indicator [LazyBear]', shorttitle='HVI_LB')
lengthhvi = input(200, group="HawkEye Volume Indicator")
range_1HVI = high - low
rangeAvg = ta.sma(range_1HVI, lengthhvi)

volumeA = ta.sma(volume, lengthhvi)
divisor = input(1)

high1 = high[1]
low1 = low[1]
mid1 = hl2[1]

u1 = mid1 + (high1 - low1) / divisor
d1 = mid1 - (high1 - low1) / divisor

r_enabled1 = range_1HVI > rangeAvg and close < d1 and volume > volumeA
r_enabled2 = close < mid1
r_enabled = r_enabled1 or r_enabled2

g_enabled1 = close > mid1
g_enabled2 = range_1HVI > rangeAvg and close > u1 and volume > volumeA
g_enabled3 = high > high1 and range_1HVI < rangeAvg / 1.5 and volume < volumeA
g_enabled4 = low < low1 and range_1HVI < rangeAvg / 1.5 and volume > volumeA
g_enabled = g_enabled1 or g_enabled2 or g_enabled3 or g_enabled4

gr_enabled1 = range_1HVI > rangeAvg and close > d1 and close < u1 and volume > volumeA and volume < volumeA * 1.5 and volume > volume[1]
gr_enabled2 = range_1HVI < rangeAvg / 1.5 and volume < volumeA / 1.5
gr_enabled3 = close > d1 and close < u1
gr_enabled = gr_enabled1 or gr_enabled2 or gr_enabled3

v_color = gr_enabled ? color.gray : g_enabled ? color.green : r_enabled ? color.red : color.blue
//plot(volume, style=plot.style_histogram, color=v_color, linewidth=5)

HVILongEntry = g_enabled
HVIShortEntry = r_enabled

//////////////////////////////////////
//* Put your strategy rules below *//
/////////////////////////////////////

longCondition = PSARLongEntry and MALongEntry and HVILongEntry and SQZMOMLongEntry
shortCondition = PSARShortEntry and MAShortEntry and HVIShortEntry and SQZMOMShortEntry

//define as 0 if do not want to use
closeLongCondition = 0
closeShortCondition = 0


// ADX
//░░░░░░░░░░░░░░░░░░░░░░░░░░░░░░░░░░░░░░░░░░░░░░░░░░░░░░░░░░░░░░░░░░░░░░░░░░░░░░░░░░░░░░░░░░░░░░░░░░░░░░░░░░░░░░░░░░░░░░░░░░░░░░░░░░░░░░░░░░░░░░░░░░

adxEnabled = input.bool(defval = false , title = "Average Directional Index (ADX)", tooltip = "", group ="ADX" ) 
adxlen = input(14, title="ADX Smoothing", group="ADX")
adxdilen = input(14, title="DI Length", group="ADX")
adxabove = input(25, title="ADX Threshold", group="ADX")

adxdirmov(len) =>
	adxup = ta.change(high)
	adxdown = -ta.change(low)
	adxplusDM = na(adxup) ? na : (adxup > adxdown and adxup > 0 ? adxup : 0)
	adxminusDM = na(adxdown) ? na : (adxdown > adxup and adxdown > 0 ? adxdown : 0)
	adxtruerange = ta.rma(ta.tr, len)
	adxplus = fixnan(100 * ta.rma(adxplusDM, len) / adxtruerange)
	adxminus = fixnan(100 * ta.rma(adxminusDM, len) / adxtruerange)
	[adxplus, adxminus]
adx(adxdilen, adxlen) =>
	[adxplus, adxminus] = adxdirmov(adxdilen)
	adxsum = adxplus + adxminus
	adx = 100 * ta.rma(math.abs(adxplus - adxminus) / (adxsum == 0 ? 1 : adxsum), adxlen)

adxsig = adxEnabled ? adx(adxdilen, adxlen) : na
isADXEnabledAndAboveThreshold = adxEnabled ? (adxsig > adxabove) : true

//Backtesting Time Period (Input.time not working as expected as of 03/30/2021.  Giving odd start/end dates
//░░░░░░░░░░░░░░░░░░░░░░░░░░░░░░░░░░░░░░░░░░░░░░░░░░░░░░░░░░░░░░░░░░░░░░░░░░░░░░░░░░░░░░░░░░░░░░░░░░░░░░░░░░░░░░░░░░░░░░░░░░░░░░░░░░░░░░░░░░░░░░░░░░
useStartPeriodTime = input.bool(true, 'Start', group='Date Range', inline='Start Period')
startPeriodTime = input(timestamp('1 Jan 2019'), '', group='Date Range', inline='Start Period')
useEndPeriodTime = input.bool(true, 'End', group='Date Range', inline='End Period')
endPeriodTime = input(timestamp('31 Dec 2030'), '', group='Date Range', inline='End Period')

start = useStartPeriodTime ? startPeriodTime >= time : false
end = useEndPeriodTime ? endPeriodTime <= time : false
calcPeriod = true

// Trade Direction 
// ░░░░░░░░░░░░░░░░░░░░░░░░░░░░░░░░░░░░░░░░░░░░░░░░░░░░░░░░░░░░░░░░░░░░░░░░░░░░░░░░░░░░░░░░░░░░░░░░░░░░░░░░░░░░░░░░░░░░░░░░░░░░░░░░░░░░░░░░░░░░░░░░░░
tradeDirection = input.string('Long and Short', title='Trade Direction', options=['Long and Short', 'Long Only', 'Short Only'], group='Trade Direction')

// Percent as Points
// ░░░░░░░░░░░░░░░░░░░░░░░░░░░░░░░░░░░░░░░░░░░░░░░░░░░░░░░░░░░░░░░░░░░░░░░░░░░░░░░░░░░░░░░░░░░░░░░░░░░░░░░░░░░░░░░░░░░░░░░░░░░░░░░░░░░░░░░░░░░░░░░░░░
per(pcnt) =>
    strategy.position_size != 0 ? math.round(pcnt / 100 * strategy.position_avg_price / syminfo.mintick) : float(na)

// Take profit 1
// ░░░░░░░░░░░░░░░░░░░░░░░░░░░░░░░░░░░░░░░░░░░░░░░░░░░░░░░░░░░░░░░░░░░░░░░░░░░░░░░░░░░░░░░░░░░░░░░░░░░░░░░░░░░░░░░░░░░░░░░░░░░░░░░░░░░░░░░░░░░░░░░░░░
tp1 = input.float(title='Take Profit 1 - Target %', defval=100, minval=0.0, step=0.5, group='Take Profit', inline='Take Profit 1')
q1 = input.int(title='% Of Position', defval=100, minval=0, group='Take Profit', inline='Take Profit 1')

// Take profit 2
// ░░░░░░░░░░░░░░░░░░░░░░░░░░░░░░░░░░░░░░░░░░░░░░░░░░░░░░░░░░░░░░░░░░░░░░░░░░░░░░░░░░░░░░░░░░░░░░░░░░░░░░░░░░░░░░░░░░░░░░░░░░░░░░░░░░░░░░░░░░░░░░░░░░
tp2 = input.float(title='Take Profit 2 - Target %', defval=100, minval=0.0, step=0.5, group='Take Profit', inline='Take Profit 2')
q2 = input.int(title='% Of Position', defval=100, minval=0, group='Take Profit', inline='Take Profit 2')

// Take profit 3
// ░░░░░░░░░░░░░░░░░░░░░░░░░░░░░░░░░░░░░░░░░░░░░░░░░░░░░░░░░░░░░░░░░░░░░░░░░░░░░░░░░░░░░░░░░░░░░░░░░░░░░░░░░░░░░░░░░░░░░░░░░░░░░░░░░░░░░░░░░░░░░░░░░░
tp3 = input.float(title='Take Profit 3 - Target %', defval=100, minval=0.0, step=0.5, group='Take Profit', inline='Take Profit 3')
q3 = input.int(title='% Of Position', defval=100, minval=0, group='Take Profit', inline='Take Profit 3')

// Take profit 4
// ░░░░░░░░░░░░░░░░░░░░░░░░░░░░░░░░░░░░░░░░░░░░░░░░░░░░░░░░░░░░░░░░░░░░░░░░░░░░░░░░░░░░░░░░░░░░░░░░░░░░░░░░░░░░░░░░░░░░░░░░░░░░░░░░░░░░░░░░░░░░░░░░░░
tp4 = input.float(title='Take Profit 4 - Target %', defval=100, minval=0.0, step=0.5, group='Take Profit')

/// Stop Loss
// ░░░░░░░░░░░░░░░░░░░░░░░░░░░░░░░░░░░░░░░░░░░░░░░░░░░░░░░░░░░░░░░░░░░░░░░░░░░░░░░░░░░░░░░░░░░░░░░░░░░░░░░░░░░░░░░░░░░░░░░░░░░░░░░░░░░░░░░░░░░░░░░░░░
stoplossPercent = input.float(title='Stop Loss (%)', defval=999, minval=0.01, group='Stop Loss') * 0.01
slLongClose = close < strategy.position_avg_price * (1 - stoplossPercent)
slShortClose = close > strategy.position_avg_price * (1 + stoplossPercent)

/// Leverage
// ░░░░░░░░░░░░░░░░░░░░░░░░░░░░░░░░░░░░░░░░░░░░░░░░░░░░░░░░░░░░░░░░░░░░░░░░░░░░░░░░░░░░░░░░░░░░░░░░░░░░░░░░░░░░░░░░░░░░░░░░░░░░░░░░░░░░░░░░░░░░░░░░░░
leverage = input.float(1, 'Leverage', step=.5, group='Leverage')
contracts = math.min(math.max(.000001, strategy.equity / close * leverage), 1000000000)


/// Trade State Management
// ░░░░░░░░░░░░░░░░░░░░░░░░░░░░░░░░░░░░░░░░░░░░░░░░░░░░░░░░░░░░░░░░░░░░░░░░░░░░░░░░░░░░░░░░░░░░░░░░░░░░░░░░░░░░░░░░░░░░░░░░░░░░░░░░░░░░░░░░░░░░░░░░░░

isInLongPosition = strategy.position_size > 0
isInShortPosition = strategy.position_size < 0

/// ProfitView Alert Syntax String Generation
// ░░░░░░░░░░░░░░░░░░░░░░░░░░░░░░░░░░░░░░░░░░░░░░░░░░░░░░░░░░░░░░░░░░░░░░░░░░░░░░░░░░░░░░░░░░░░░░░░░░░░░░░░░░░░░░░░░░░░░░░░░░░░░░░░░░░░░░░░░░░░░░░░░░

alertSyntaxPrefix = input.string(defval='CRYPTANEX_99FTX_Strategy-Name-Here', title='Alert Syntax Prefix', group='ProfitView Alert Syntax')
alertSyntaxBase = alertSyntaxPrefix + '\n#' + str.tostring(open) + ',' + str.tostring(high) + ',' + str.tostring(low) + ',' + str.tostring(close) + ',' + str.tostring(volume) + ','


/// Trade Execution
// ░░░░░░░░░░░░░░░░░░░░░░░░░░░░░░░░░░░░░░░░░░░░░░░░░░░░░░░░░░░░░░░░░░░░░░░░░░░░░░░░░░░░░░░░░░░░░░░░░░░░░░░░░░░░░░░░░░░░░░░░░░░░░░░░░░░░░░░░░░░░░░░░░░

longConditionCalc = (longCondition and isADXEnabledAndAboveThreshold)
shortConditionCalc = (shortCondition and isADXEnabledAndAboveThreshold)

if calcPeriod
    if longConditionCalc and tradeDirection != 'Short Only' and isInLongPosition == false
        strategy.entry('Long', strategy.long, qty=contracts)

        alert(message=alertSyntaxBase + 'side:long', freq=alert.freq_once_per_bar_close)

    if shortConditionCalc and tradeDirection != 'Long Only' and isInShortPosition == false
        strategy.entry('Short', strategy.short, qty=contracts)

        alert(message=alertSyntaxBase + 'side:short', freq=alert.freq_once_per_bar_close)
    
    //Inspired from Multiple %% profit exits example by adolgo https://www.tradingview.com/script/kHhCik9f-Multiple-profit-exits-example/
    strategy.exit('TP1', qty_percent=q1, profit=per(tp1))
    strategy.exit('TP2', qty_percent=q2, profit=per(tp2))
    strategy.exit('TP3', qty_percent=q3, profit=per(tp3))
    strategy.exit('TP4', profit=per(tp4))

    strategy.close('Long', qty_percent=100, comment='SL Long', when=slLongClose)
    strategy.close('Short', qty_percent=100, comment='SL Short', when=slShortClose)

    strategy.close_all(when=closeLongCondition or closeShortCondition, comment='Close Postion')

/// Dashboard
// ░░░░░░░░░░░░░░░░░░░░░░░░░░░░░░░░░░░░░░░░░░░░░░░░░░░░░░░░░░░░░░░░░░░░░░░░░░░░░░░░░░░░░░░░░░░░░░░░░░░░░░░░░░░░░░░░░░░░░░░░░░░░░░░░░░░░░░░░░░░░░░░░░░
// Inspired by https://www.tradingview.com/script/uWqKX6A2/ - Thanks VertMT