The Deutsche Bank study notes several common mistakes in the quantification strategy
Author: The Little Dream, Created: 2017-02-04 12:34:26, Updated:The Deutsche Bank study notes several common mistakes in the quantification strategy
-
One, the survivorship bias.
Survivor bias is one of the most common problems faced by investors, and many people are aware of its existence, but few pay attention to its effects. We tend to use only existing companies when reassessing, which means that we eliminate the impact of companies that have gone out of business due to bankruptcy, reorganization, or bankruptcy.
When adjusting for historical data, some bankruptcies, delistings, and underperforming stocks are regularly removed. These removed stocks do not appear in your strategic pool, which means that when reviewed in the past, only information about the current component stocks is used, eliminating the effects of those in the component stocks that were removed in the future due to poor performance or stock prices. The following chart shows the weighting of MSCI European Index component stocks as a portfolio in the past.
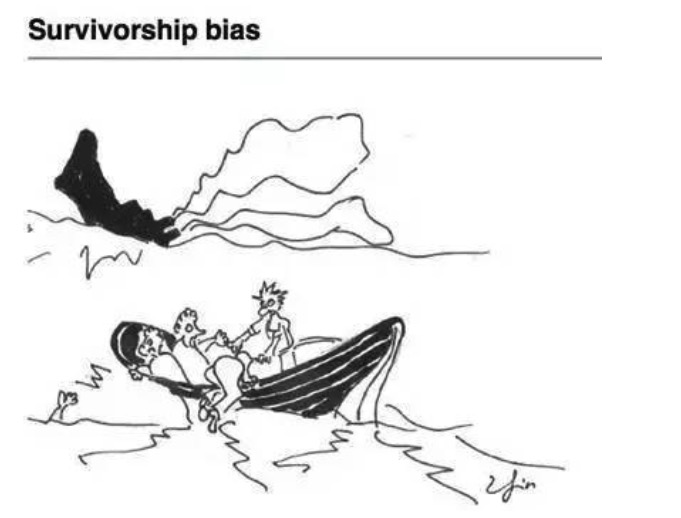 Figure 1
Survivor bias is one of the most common problems faced by investors, and many people are aware of its existence, but few pay attention to its effects. We tend to use only existing companies when reassessing, which means that we eliminate the impact of companies that have gone out of business due to bankruptcy, reorganization, or bankruptcy.
When adjusting for historical data, some bankruptcies, delistings, and underperforming stocks are regularly removed. These removed stocks do not appear in your strategic pool, which means that when reviewed in the past, only information about the current component stocks is used, eliminating the effects of those in the component stocks that were removed in the future due to poor performance or stock prices. The following chart shows the weighting of MSCI European Index component stocks as a portfolio in the past.
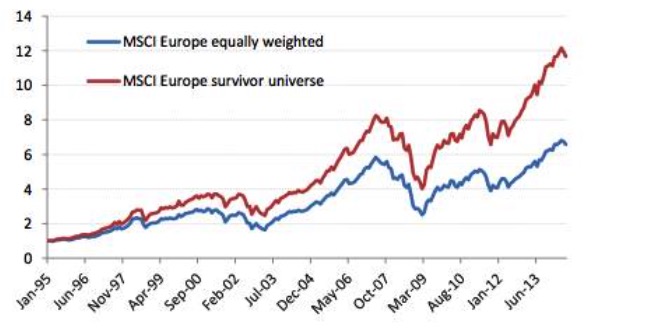 Figure 2
This means that when we look back at the best performing companies over the last 30 years, even if some companies were at high credit risk at the time, when you know who is going to survive, you can buy them when they are at high credit risk or in trouble, and the returns are very high.
There are many other factors that give the exact opposite result when considering the deviance of survivors.
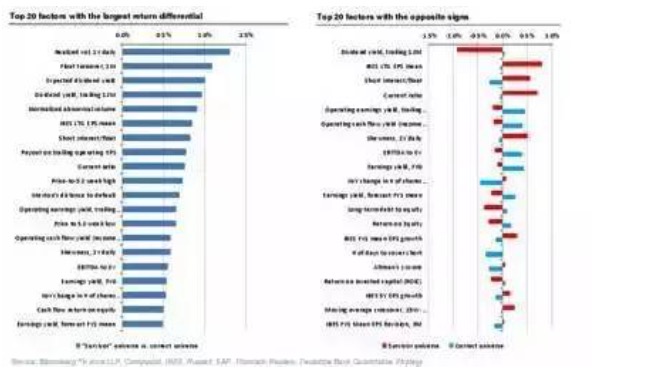 Figure 3
 -
Look-ahead bias is the tendency of a person to look ahead.
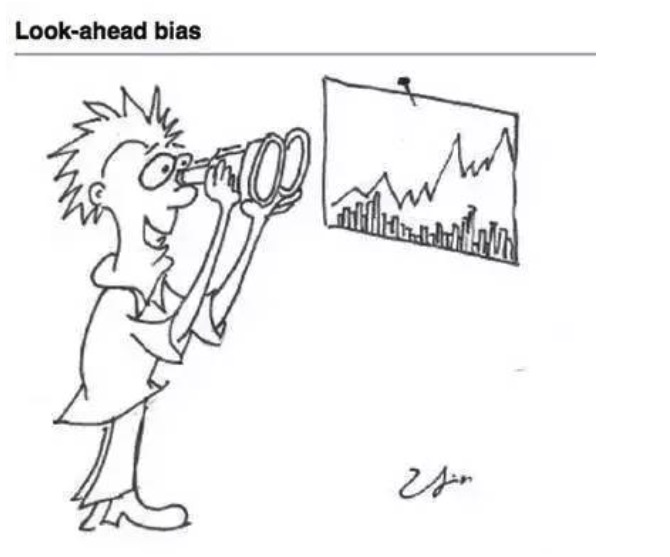 Figure four
The survivor bias, one of the seven culprits of the Great Recession, is that we cannot predict which companies will survive at a past point in time and still be an index component today, while the survivor bias is merely an exception to the forward bias. The forward bias refers to the use of data that was not available or publicly available at the time of the review, which is also the most common error in the review.
A clear example of forward-looking bias is in financial data, where corrections to the financial data are more likely to cause errors that are difficult to detect. Generally, the timing of each company's financial data release varies and there are often delays. In retrospect, we often evaluate the company's financial condition based on the timing of each company's data release.
However, when point-in-time data (PIT data) is not available at the time, the financial reporting backlog assumptions are often wrong. The following figure confirms the differences between PIT data and non-PIT data. At the same time, the final value that we often get when downloading historical macroeconomic data after being modified, but many developed country GDP data are released after two adjustments, the results of large companies are often modified.
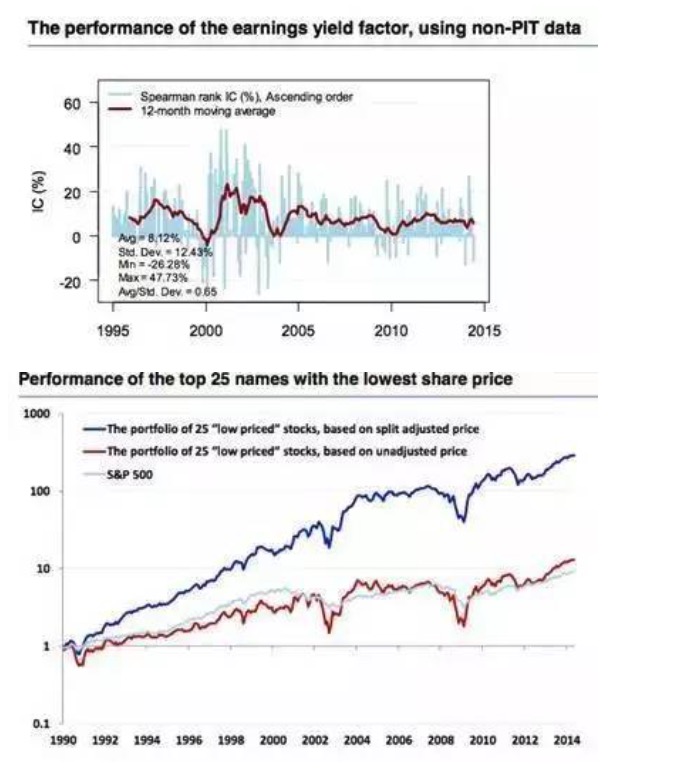 Figure 5
 -
The sin of storytelling
 Figure 6
Some people like to tell a story without any data, while those who do quantitative work like to tell a story with data and results. There are many similarities between the two situations, and those who are good at telling stories or those who are good at interpreting data results often have a script in their mind that is already established before they get the data.
Looking back at the US tech stocks and the Russell 3000 index for the two periods 1997-2000 and 2000-2002, we find a very opposite conclusion. From the US tech stocks of 1997-2000, profitability is a good factor, and retrospective results are very reliable, however, if we stretch the interval to 2002, we find that the profitability indicator is no longer a good factor.
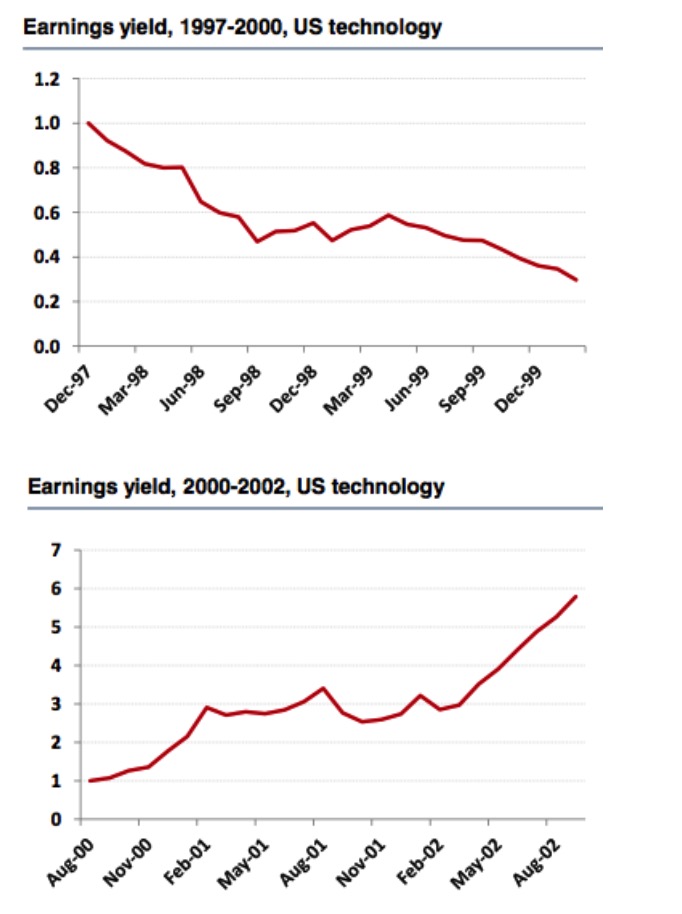 Figure 7
However, from the market performance of the Russell 3000 Index, we have come to the opposite conclusion, that the profitability indicator is still an effective factor, as can be seen, the length of time the stock pool is selected and re-measured has a great impact on the effectiveness of the factor judgment.
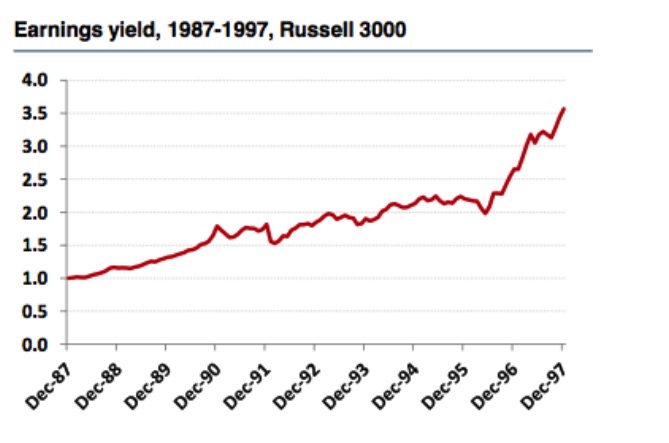 Figure 8
Every day, the market discovers new and better factors, looking for a perpetual engine. The strategies that can be released are good feedback. While the narrator's interpretation of history is very moving, its predictions of the future are almost useless. In financial economics, correlation and causality are often difficult to understand, so it is best not to be a narrator when we make results that contradict common sense or are consistent with the original judgement.
-
Data mining and data snooping
 Figure 9
Data mining is arguably a hot topic at the moment, based on huge amounts of data and computer-supported computing, where people often hope to get a subtle feedback loop. However, the original financial data is not yet as large, and transactional data does not meet the prerequisites of low-noise data.
Sometimes data mining is almost ineffective. For example, we modeled the S&P 500 using two different factor-weighted algorithms and selected 2009-2014 data for retesting. The results showed that retesting using the six best performing factors from 2009-2014 and using e.g. weighted algorithms was very perfect, whereas retesting using a sample of historical data was a straight line.
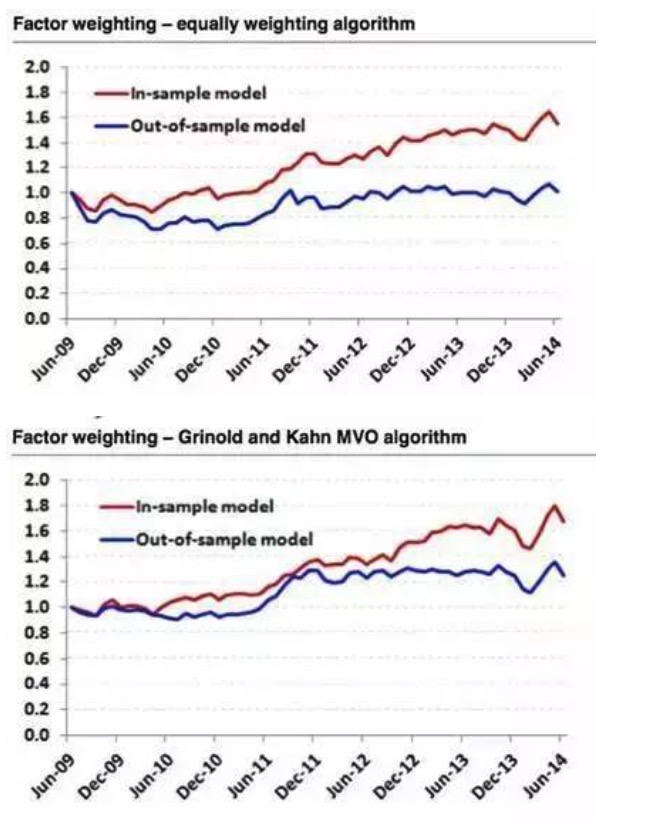 Figure 10
Therefore, we should all have clear logic and motivation when building strategies or looking for good factors, and quantitative analysis is only a tool to verify our own logic or motivation, not to find a shortcut to logic. Generally speaking, our motivation to build strategies or look for factors stems from theoretical knowledge of the fundamentals of finance, market efficiency, behavioral finance, and other areas. Of course, we do not deny the value of data mining applications in the field of quantification.
-
Signal decay, turnover, and transaction cost
 Figure 11
Signal attenuation refers to the ability to predict how long a stock will return in the future after a factor is generated. Generally, high swap rates and signal attenuation are related. Different stock selection factors often have different information attenuation characteristics. Faster signal attenuation often requires higher swap rates to earn returns. However, higher swap rates often mean higher transaction costs.
So, how do we determine the optimal adjustment frequency? We need to note that tightening the exchange rate constraint does not mean reducing the frequency of the adjustment. For example, we often hear similar phrases. We are long-term value investors, we expect to hold stocks for 3-5 years. Therefore, we adjust once a year.
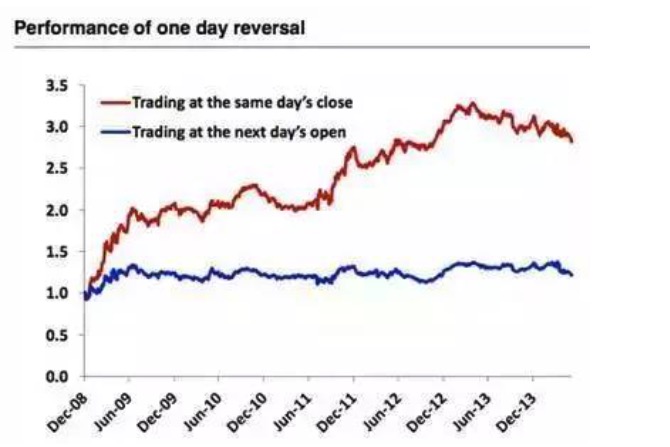 Figure 12
When we buy the 100 worst performing stocks of the day at the close of the day, we sell the holdings of the past, continuing daily trading, with very high returns. The error here is also forward-looking bias, and before closing, we do not know which stocks performed worst on the day, that is, using programmatic trading, this strategy is also not feasible. We can only buy the 100 worst performing stocks of yesterday at the opening price of the day. By contrast, the strategy of buying at the opening price is almost straightforward.
-
The outliers are:
 Figure 13
The standardisation of data can also be seen as one of the methods of controlling anomalies, and the standardization technique has the potential to have a significant impact on the performance of the model. For example, the profit margin of the S&P BMI Korea Index component stocks in the figure below, the results of methods such as averaging, subtracting 1% and 2% extremes vary greatly.
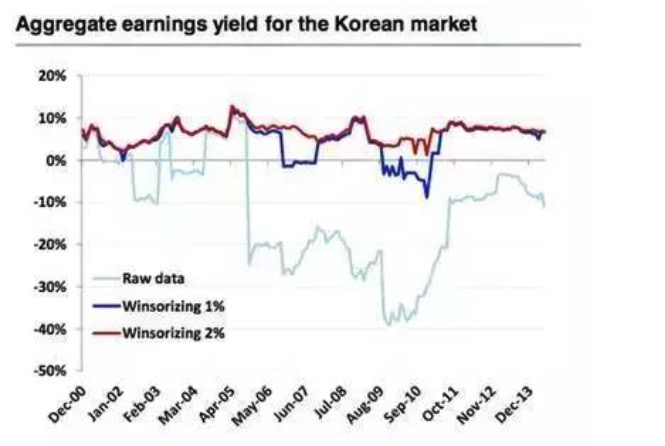 Figure 14
While anomalies may contain useful information, in most cases they do not. Exceptions are made for price dynamics, of course. The blue line is the combined representation after the anomalies have been removed, and the red line is the raw data. We can see that the dynamic strategy of the raw data is much better than the one after the anomalies have been removed.
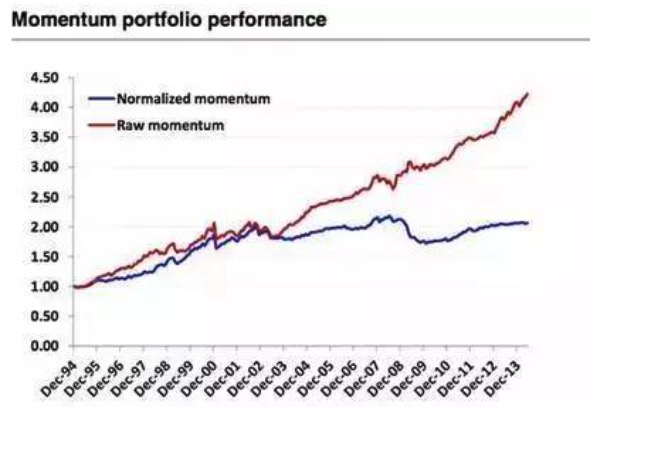 Figure 15
 -
The asymmetric payoff pattern and shorting
 Figure 16
In general, the most common strategy for doing multi-factor strategies is the multi-space strategy, i.e. doing many good stocks and doing bad stocks at the same time. Unfortunately, not all factors are equal, and the asymmetry of the multi-space earnings characteristics of most factors, coupled with the possible costs and feasibility of doing bad stocks, also causes considerable difficulties for quantifying investments. The chart below shows the multi-space earnings characteristics of the factors, arranged by size of difference.
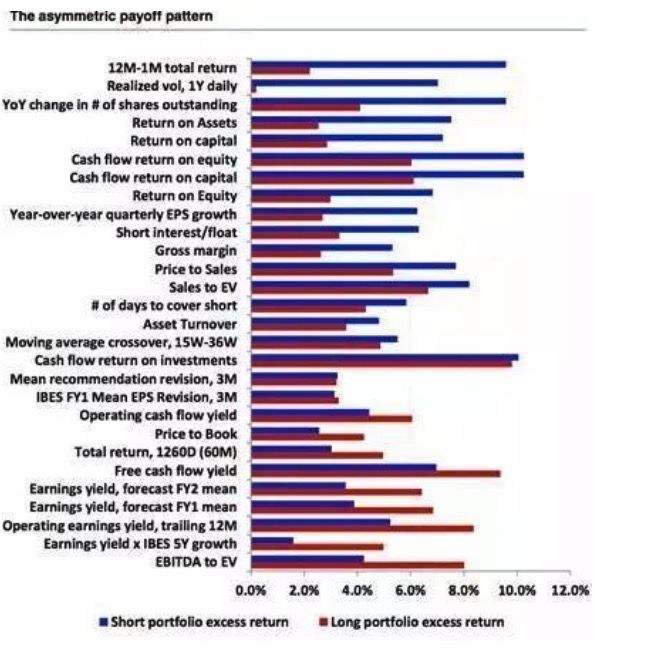 Figure 17
Source: Walking on Wall Street
- 2.7.1 Windows 32-bit system Python 2.7 environment Install the talib index library
- Details of futures options
- Why are many commodity futures contracts primarily traded in January, May and September each year?
- China's four largest futures exchanges exposed
- 1.4 Futures Basics of knowledge
- Not support market order error
- Inventors describe the mechanism of quantitative analogue level retesting
- The K-Line is not compatible with mainstream channels.
- Quantitative trading "reverse investment from the mean to the return"
- I've been reading a lot about equity, counter-equity, the profit formula, the gambler's loss theorem (very inspiring).
- Bitcoin contracts for okcoin: the dollar-renminbi exchange rate problem
- The more complex the method, the more it deviates from the essence of the transaction.
- Quantified trading strategies for the CCI indicator
- Commodity futures reassessment price changes are not continuous
- About data storage
- Summary of fees related to digital currency exchanges ((updated on 02/13/2017))
- English comparison of common quantitative terms, trading terms, and terms
- He is the key step to open systematization and short line high frequency trading.
- Ask for help: How to get the opening and closing prices of a k-line
- Synthesis of 4-hour K-string function ((First throw the cube, later give the code for synthesis of arbitrary cycle)