Multi-Technical Indicator Trend Following Strategy with Ichimoku Cloud Breakout and Stop-Loss System

Overview
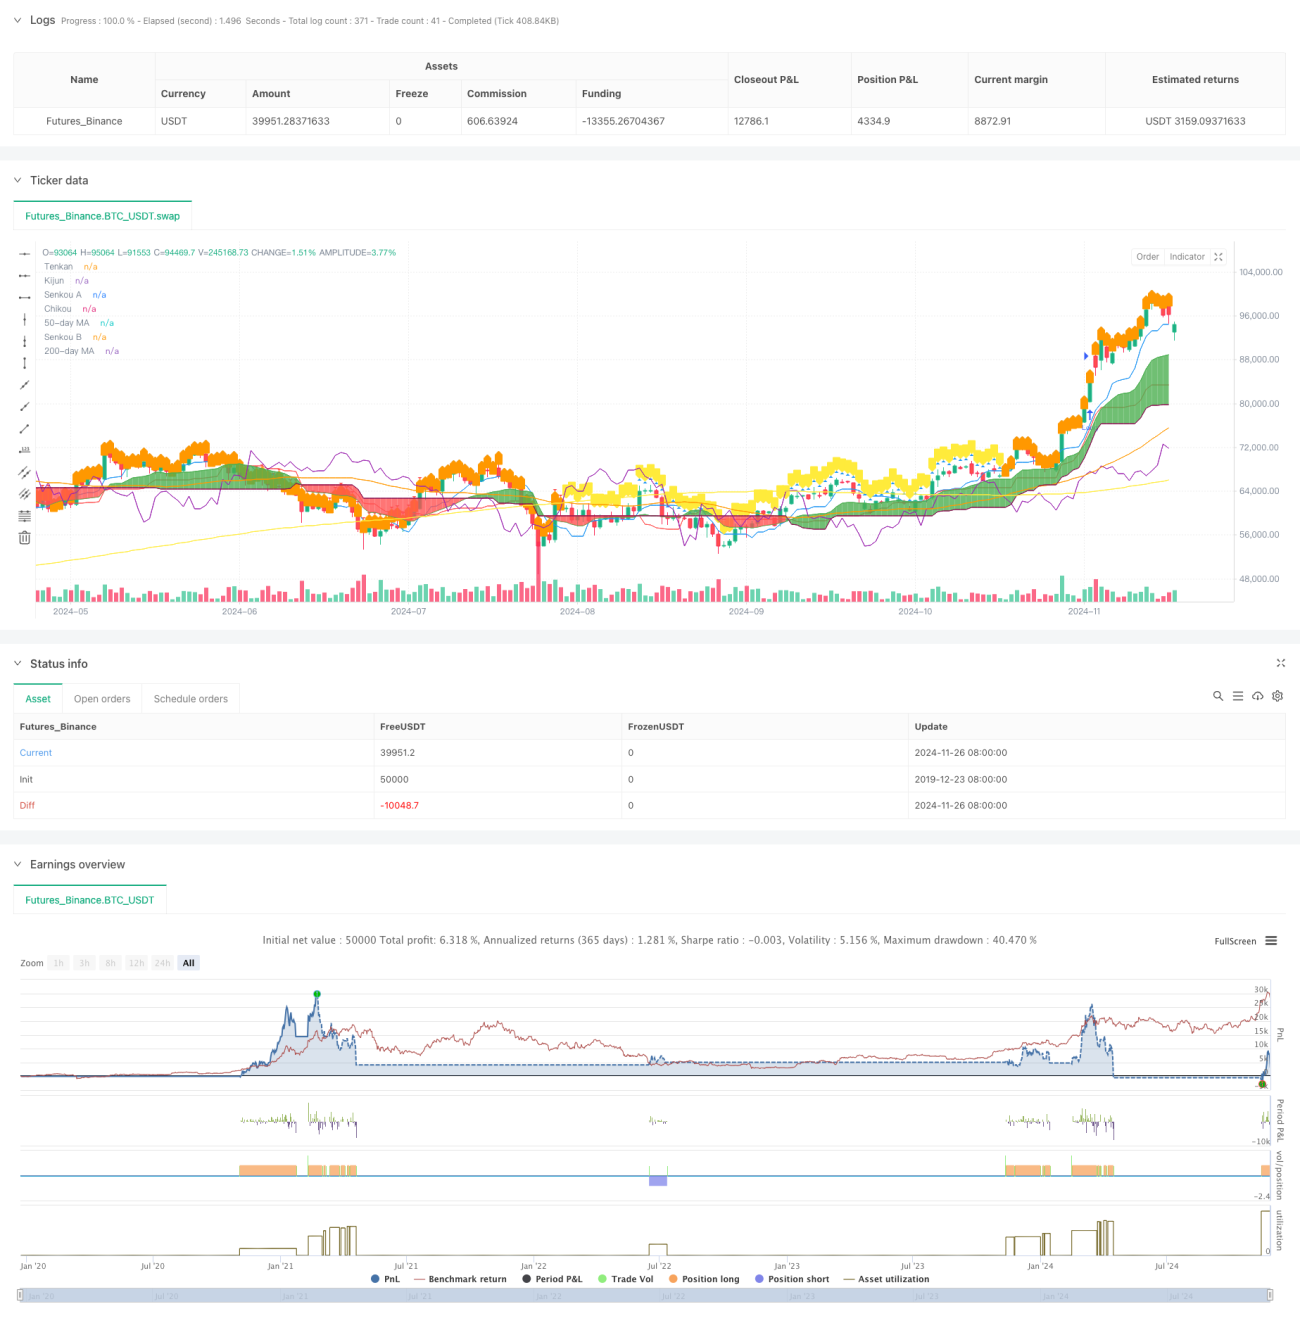
This strategy is a comprehensive trading system that combines multiple technical indicators, primarily based on the Ichimoku Cloud indicator for trading decisions. The system determines entry points through the crossing of Tenkan and Kijun lines, while incorporating RSI and Moving Averages as auxiliary filtering conditions. The strategy uses cloud components as dynamic stop-loss levels, forming a complete risk control system.
Strategy Principles
The core logic of the strategy is based on the following key elements:
- Entry signals are generated by Tenkan-Kijun crossovers, with upward crosses forming long signals and downward crosses forming short signals
- Price position relative to the Kumo (cloud) serves as trend confirmation, going long above the cloud and short below it
- The relationship between 50-day and 200-day moving averages acts as a trend filter
- Weekly RSI indicator confirms market strength, filtering out false signals
- Cloud boundaries are used as dynamic stop-loss positions for dynamic risk management
Strategy Advantages
- The combination of multiple technical indicators provides more reliable trading signals, significantly reducing the impact of false signals
- Using the cloud as a dynamic stop-loss can automatically adjust stop-loss positions based on market volatility, both protecting profits and allowing sufficient price movement
- Weekly RSI filtering effectively avoids unfavorable trades in overbought/oversold areas
- Moving average crossovers provide additional trend confirmation, improving trade success rates
- Complete risk control system covering entry, position holding, and exit phases
Strategy Risks
- Multiple indicator filtering may cause missing some potential good opportunities
- May generate frequent false breakout signals in ranging markets
- The Ichimoku Cloud indicator has inherent lag, which may affect entry timing
- Dynamic stop-loss positions may be too loose in rapidly volatile markets
- Excessive filtering conditions may reduce trading opportunities, affecting overall strategy returns
Strategy Optimization Directions
- Introduce volatility indicators to adjust strategy parameters based on market volatility
- Optimize cloud parameters to better suit different market environments
- Add volume analysis to improve signal reliability
- Implement time filtering mechanisms to avoid highly volatile periods
- Develop adaptive parameter optimization system for dynamic strategy adjustment
Summary
This strategy builds a complete trading system by combining multiple technical indicators. The strategy not only focuses on signal generation but also includes a comprehensive risk control mechanism. Through multiple filtering conditions, it effectively improves trade success rates. Meanwhile, the dynamic stop-loss design provides the strategy with a good risk-reward ratio. While there is room for optimization, it is overall a well-structured strategy system with clear logic.
- 1