RSI par zdmre
Auteur:ChaoZhang est là., Date: 2022-05-13 16h34 et 43 minLes étiquettes:RMA
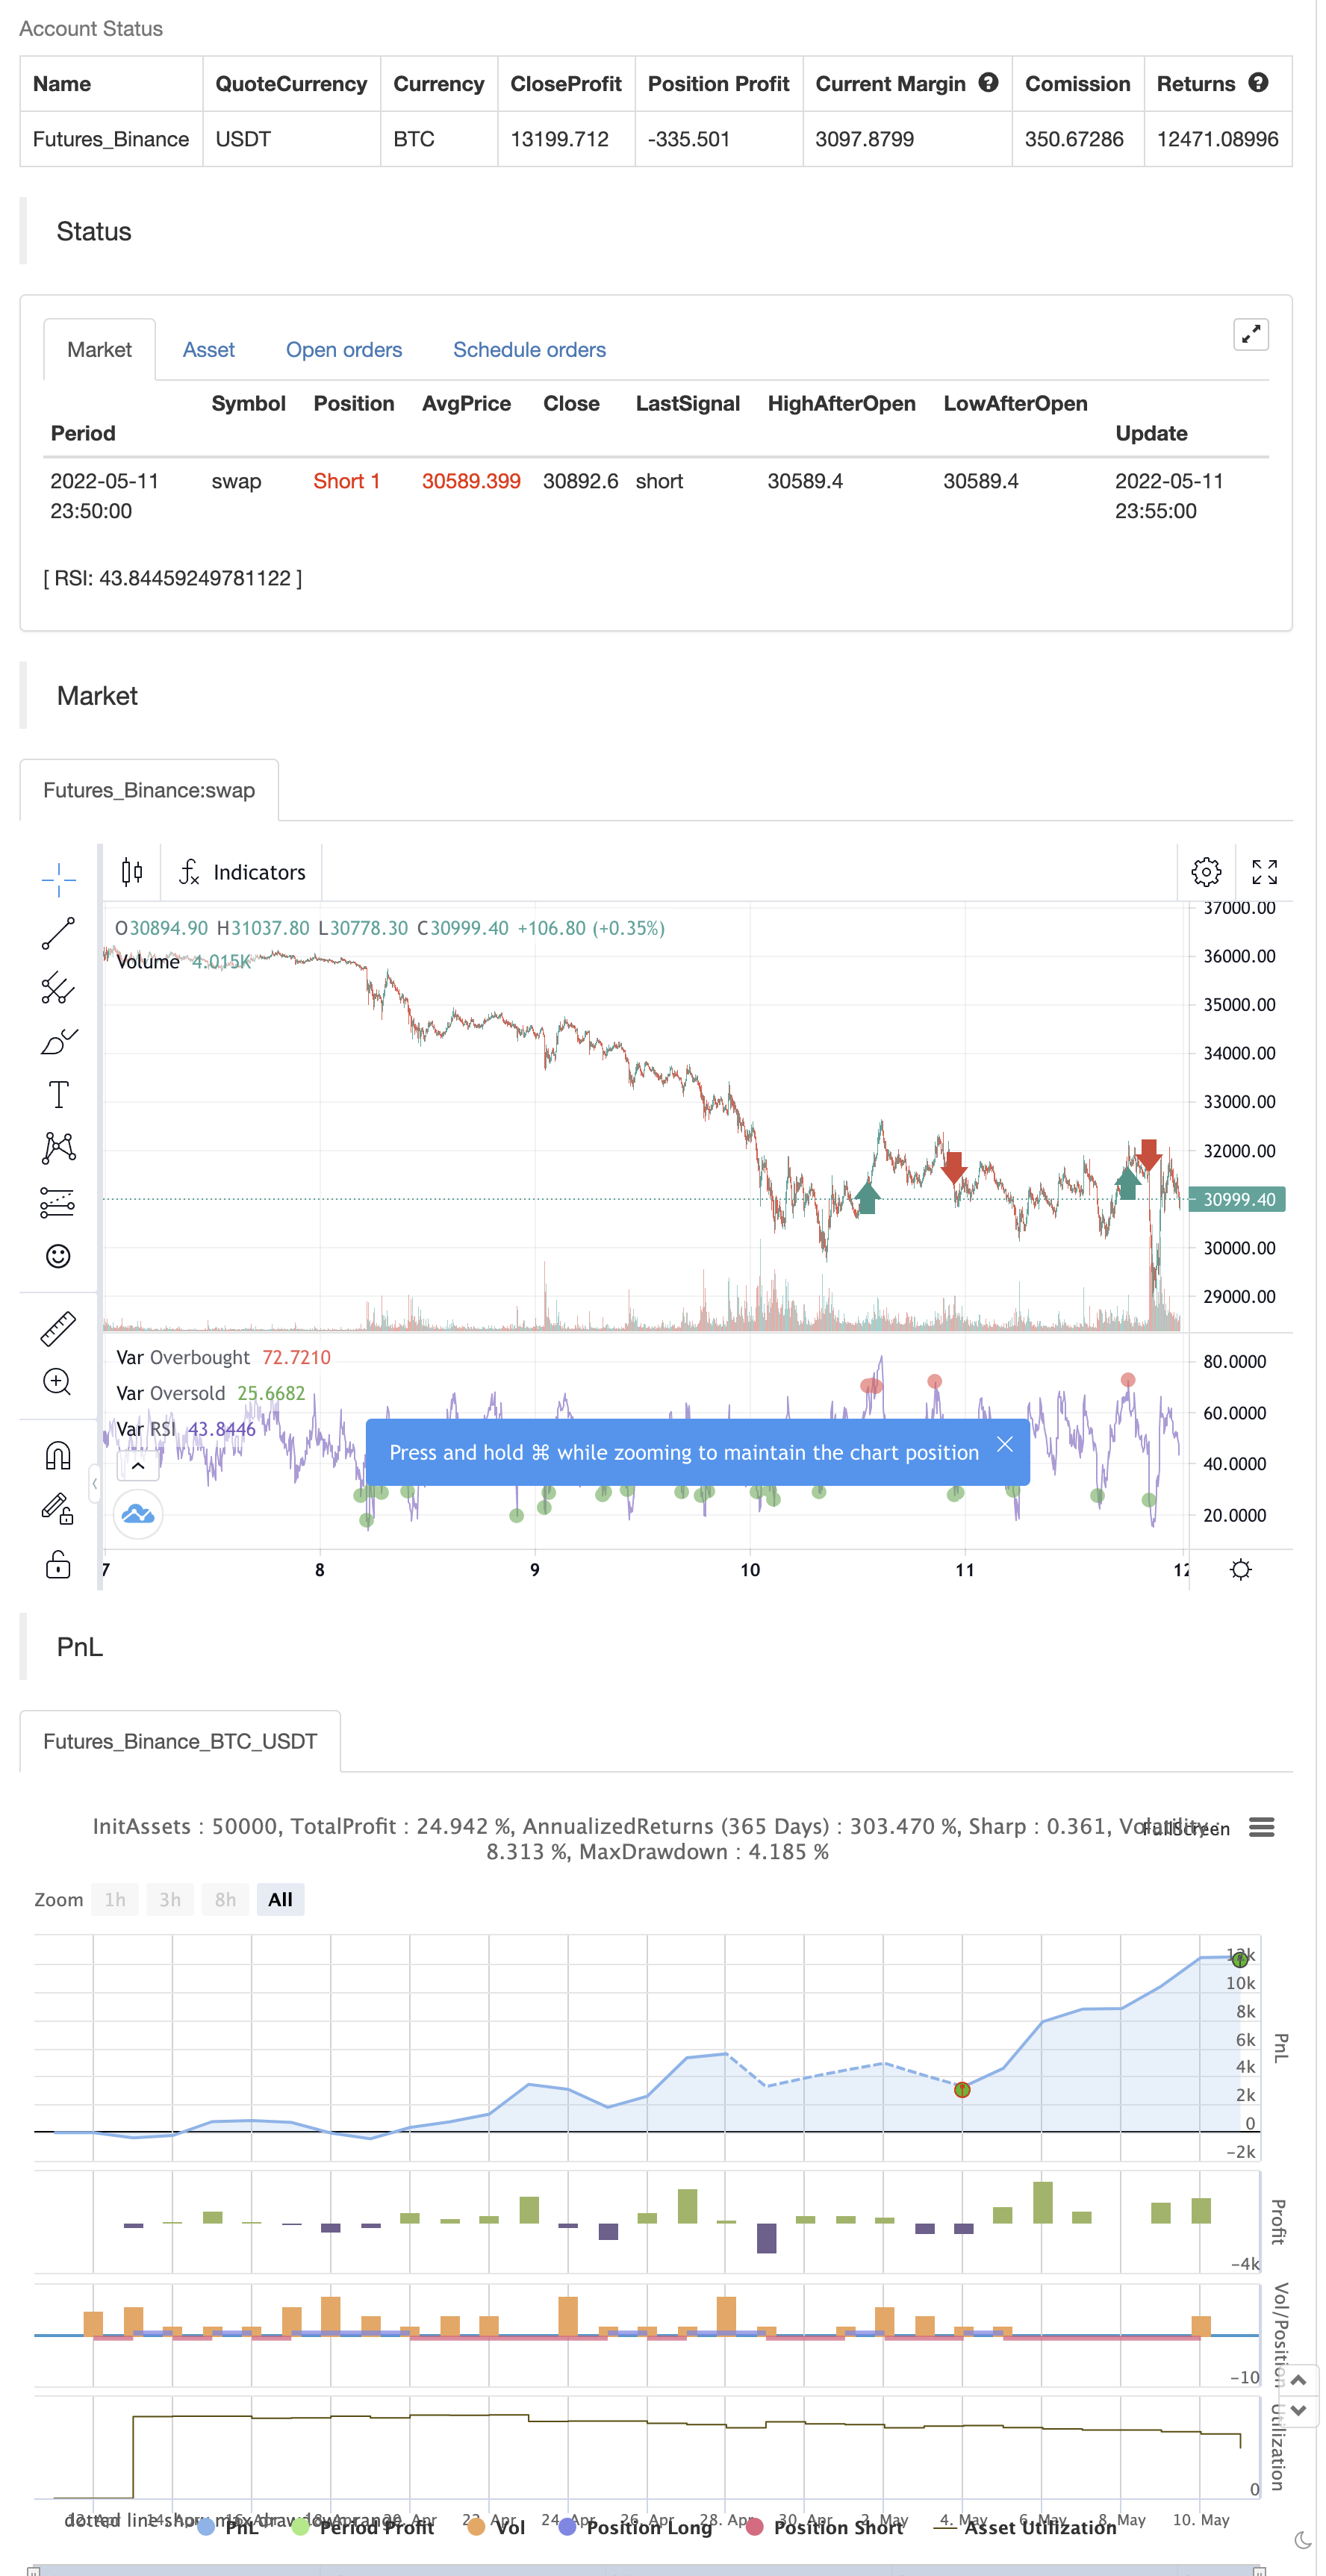
Les interprétations et l'utilisation traditionnelles de l'indice de volatilité indiquent que des valeurs de 70 ou plus suggèrent qu'un titre devient suracheté ou surévalué et peut être préparé à un renversement de tendance ou à un recul correctif des prix.
30 = survente 70 = suracheté
Merci @DieGobelMonte pour votre suggestion.
test de retour
/*backtest
start: 2022-04-12 00:00:00
end: 2022-05-11 23:59:00
period: 5m
basePeriod: 1m
exchanges: [{"eid":"Futures_Binance","currency":"BTC_USDT"}]
*/

// This source code is subject to the terms of the Mozilla Public License 2.0 at https://mozilla.org/MPL/2.0/
// © zdmre

//@version=5
indicator("RSI by zdmre", overlay=false)

len = input.int(14, minval=1, title='Length')
src = input(close, 'Source')
up = ta.rma(math.max(ta.change(src), 0), len)
down = ta.rma(-math.min(ta.change(src), 0), len)
rsi = down == 0 ? 100 : up == 0 ? 0 : 100 - 100 / (1 + up / down)
plot(rsi, 'RSI', color=color.new(#7E57C2, 0))
band1 = hline(70, "Upper Band", color=#787B86)
bandm = hline(50, "Middle Band", color=color.new(#787B86, 50))
band0 = hline(30, "Lower Band", color=#787B86)
fill(band1, band0, color=color.rgb(126, 87, 194, 90), title="Background")

ob= ta.cross(rsi, 70) == 1 and rsi >= 70
os = ta.cross(rsi, 30) == 1 and rsi <= 30

plot(ob ? rsi : na ,title='Overbought', style=plot.style_circles, color=color.new(color.red, 0), linewidth=5)
plot(os ? rsi : na ,title='Oversold ', style=plot.style_circles, color=color.new(color.green, 0), linewidth=5)

if ob
    strategy.entry("Enter Long", strategy.long)
else if os
    strategy.entry("Enter Short", strategy.short)
Relationnée
- Stratégie de renversement de tendance de Fibonacci
- VWMA-ADX Momentum et stratégie longue Bitcoin basée sur la tendance
- Scalping EMA ADX RSI avec achat/vente
- FTSMA - Trend est votre ami
- Une stratégie de victoire sans faille
- Meilleure stratégie d' engloutissement + de rupture
- Super scalper - 5 minutes 15 minutes
- Superjump retourner en arrière Bollinger Band
- La tendance de Fukuiz
- SSL hybride
- ZigZag basé sur l'élan
Plus de
- Le chef de file
- Points de pivotement haut bas multi-temps
- Une base de données de stratégies de suivi de la tendance fantôme
- Les phantômes suivent les stratégies de l'entreprise
- Les stratégies de suivi de la tendance fantôme
- Oscillateur arc-en-ciel
- Exemple de dimensionnement des positions de négociation de la courbe des actions
- Une démonstration de KLineChart
- Stratégie de super-tendance à pivot dynamique
- La super tendance de Crodl
- FTL - Filtre de portée X2 + EMA + UO
- Le BRAHMASTRA
- Bandes de Mobo
- SAR + 3SMMA avec SL et TP
- Résultats
- Modèle d'alerte de lancement lunaire [indicateur]
- HALFTREND + HEMA + SMA (stratégie du faux signal)
- RSI Divergence avec le pivot, BB, SMA, EMA, SMMA, WMA, VWMA
- RSI et BB et survendus simultanément
- Des bougies Heikin Ashi en roulement