RSI oleh zdmre
Penulis:ChaoZhang, Tanggal: 2022-05-13 16:34:43Tag:RMA
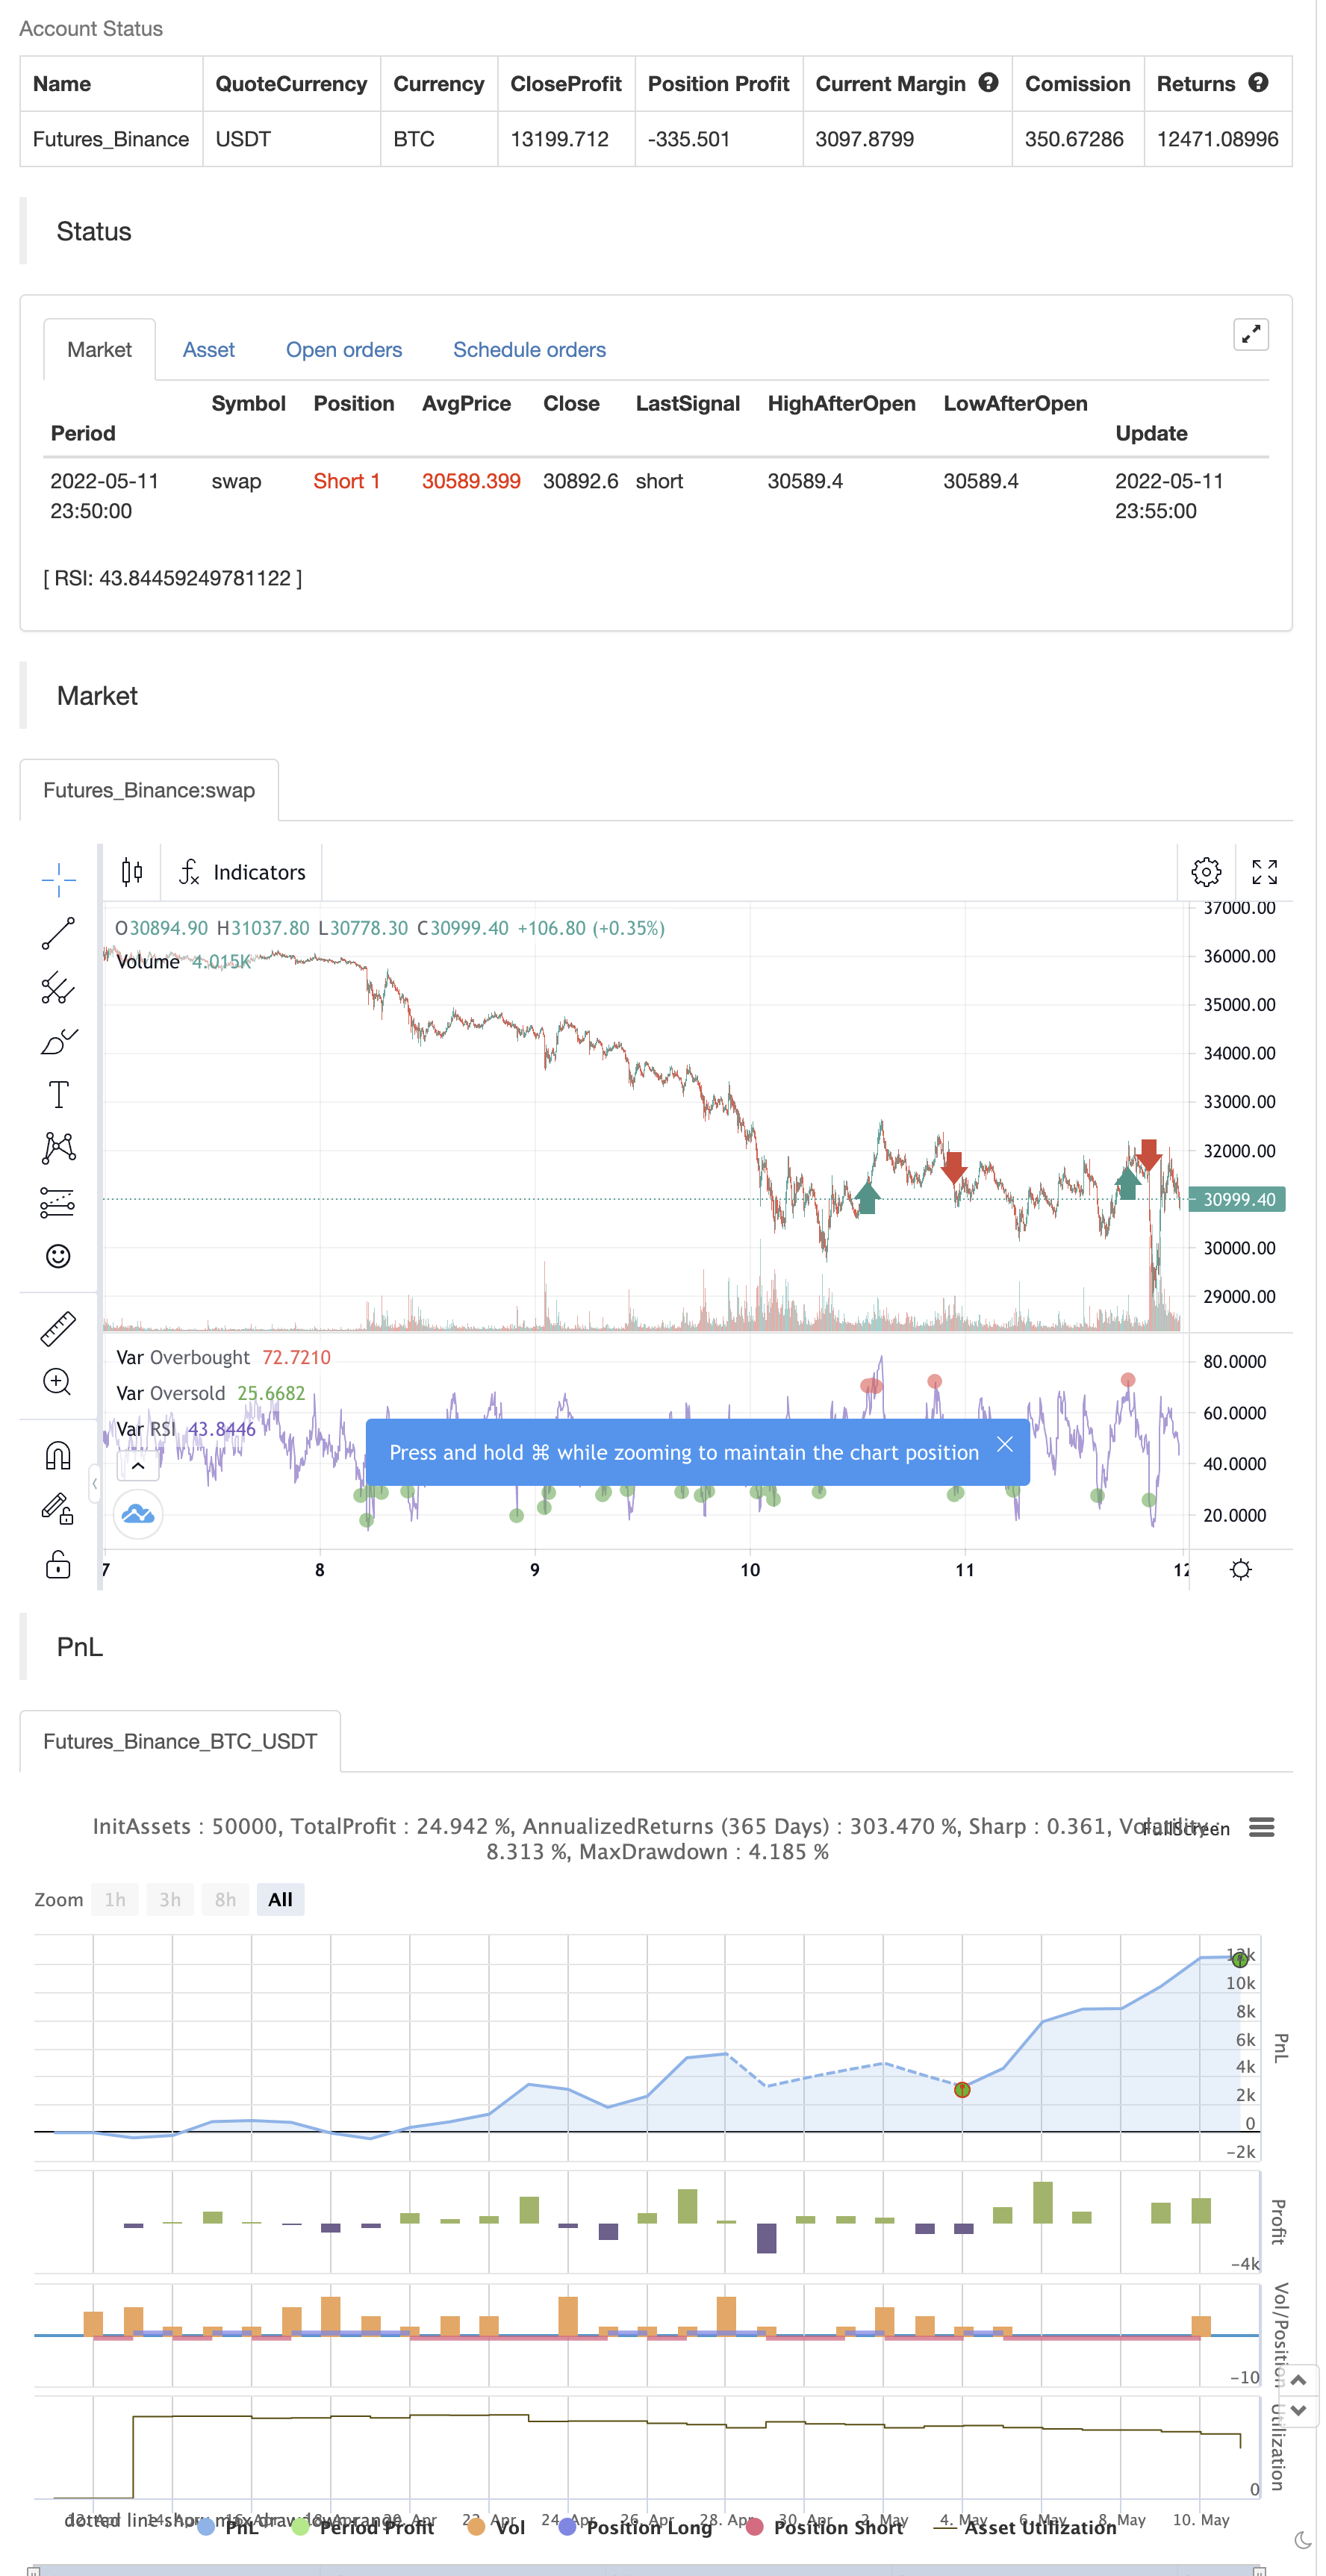
Interpretasi tradisional dan penggunaan RSI mendikte bahwa nilai 70 atau di atas menunjukkan bahwa sekuritas menjadi overbought atau overvalued dan dapat dipersiapkan untuk pembalikan tren atau penarikan harga korektif.
30 = Terlalu Terjual 70 = Terlalu Terbeli
Terima kasih @DieGobelMonte atas saranmu.
backtest
/*backtest
start: 2022-04-12 00:00:00
end: 2022-05-11 23:59:00
period: 5m
basePeriod: 1m
exchanges: [{"eid":"Futures_Binance","currency":"BTC_USDT"}]
*/

// This source code is subject to the terms of the Mozilla Public License 2.0 at https://mozilla.org/MPL/2.0/
// © zdmre

//@version=5
indicator("RSI by zdmre", overlay=false)

len = input.int(14, minval=1, title='Length')
src = input(close, 'Source')
up = ta.rma(math.max(ta.change(src), 0), len)
down = ta.rma(-math.min(ta.change(src), 0), len)
rsi = down == 0 ? 100 : up == 0 ? 0 : 100 - 100 / (1 + up / down)
plot(rsi, 'RSI', color=color.new(#7E57C2, 0))
band1 = hline(70, "Upper Band", color=#787B86)
bandm = hline(50, "Middle Band", color=color.new(#787B86, 50))
band0 = hline(30, "Lower Band", color=#787B86)
fill(band1, band0, color=color.rgb(126, 87, 194, 90), title="Background")

ob= ta.cross(rsi, 70) == 1 and rsi >= 70
os = ta.cross(rsi, 30) == 1 and rsi <= 30

plot(ob ? rsi : na ,title='Overbought', style=plot.style_circles, color=color.new(color.red, 0), linewidth=5)
plot(os ? rsi : na ,title='Oversold ', style=plot.style_circles, color=color.new(color.green, 0), linewidth=5)

if ob
    strategy.entry("Enter Long", strategy.long)
else if os
    strategy.entry("Enter Short", strategy.short)
Berkaitan
- Strategi Pembalikan Tren Fibonacci
- VWMA-ADX Momentum dan Strategi Bitcoin Long Berbasis Tren
- Scalping EMA ADX RSI dengan Buy/Sell
- FTSMA - Trend adalah temanmu
- Strategi Kemenangan yang Sempurna
- BEST Engulfing + Breakout Strategi
- Super Scalper - 5 menit 15 menit
- SuperJump Turn Back Bollinger Band
- Tren Fukuiz
- SSL hibrida
- ZigZag berdasarkan momentum
Lebih banyak
- Sidboss
- Titik Pivot Tinggi Rendah Multi Time Frame
- Database Strategi Pelacakan Tren Hantu
- Ghoul Trends Track Strategi Perpustakaan Bisnis
- Strategi Pelacakan Tren Hantu
- Rainbow Oscillator
- Perdagangan kurva ekuitas Contoh Ukuran Posisi
- KLineChart Demo
- Villa Dinamic Pivot Supertrend Strategi
- Crodl's Supertrend
- FTL - Range Filter X2 + EMA + UO
- Brahmastra
- Band Mobo
- SAR + 3SMMA dengan SL & TP
- SSS
- Templat Peringatan Peluncuran Bulan [Indikator]
- HALFTREND + HEMA + SMA (Strategi Sinyal Palsu)
- RSI Divergensi dengan Pivot, BB, SMA, EMA, SMMA, WMA, VWMA
- RSI dan BBand oversold secara bersamaan
- Gulung Lilin Heikin Ashi