EMA トレンドクラウド
作者: リン・ハーンチャオチャン開催日:2022年5月18日15時32分51秒タグ:エイマ
これは取引のアドバイスではありません.保証はありません.自分のリスクで使用してください.
9期と20期指数関数移動平均線 (EMA) をグラフ化し,その間の雲を描き,日中のトレンドとその強さを視覚的に識別する. 長いために緑の雲,短いために赤の雲. 雲が厚くなるほどトレンドが強くなる. ロングプレイエントリは,9 EMA が20 EMA を越えて,雲が緑色に変わることを引き起こします.
アグレシブエントリーとは,クロスの発生の原因となるバーの閉じる部分である.保守的なエントリーとは,クロスの後の2番目のバーが9 EMA以上でプレイの方向に閉ざされたときである.
出口は,価格がクラウドまたはクラウドの反対側で閉じる時,または平均が取引の反対方向に交差するときに,個人のリスク耐性によって起こる可能性があります.
これは取引のアドバイスではありません.保証はありません.自分のリスクで使用してください.
バックテスト
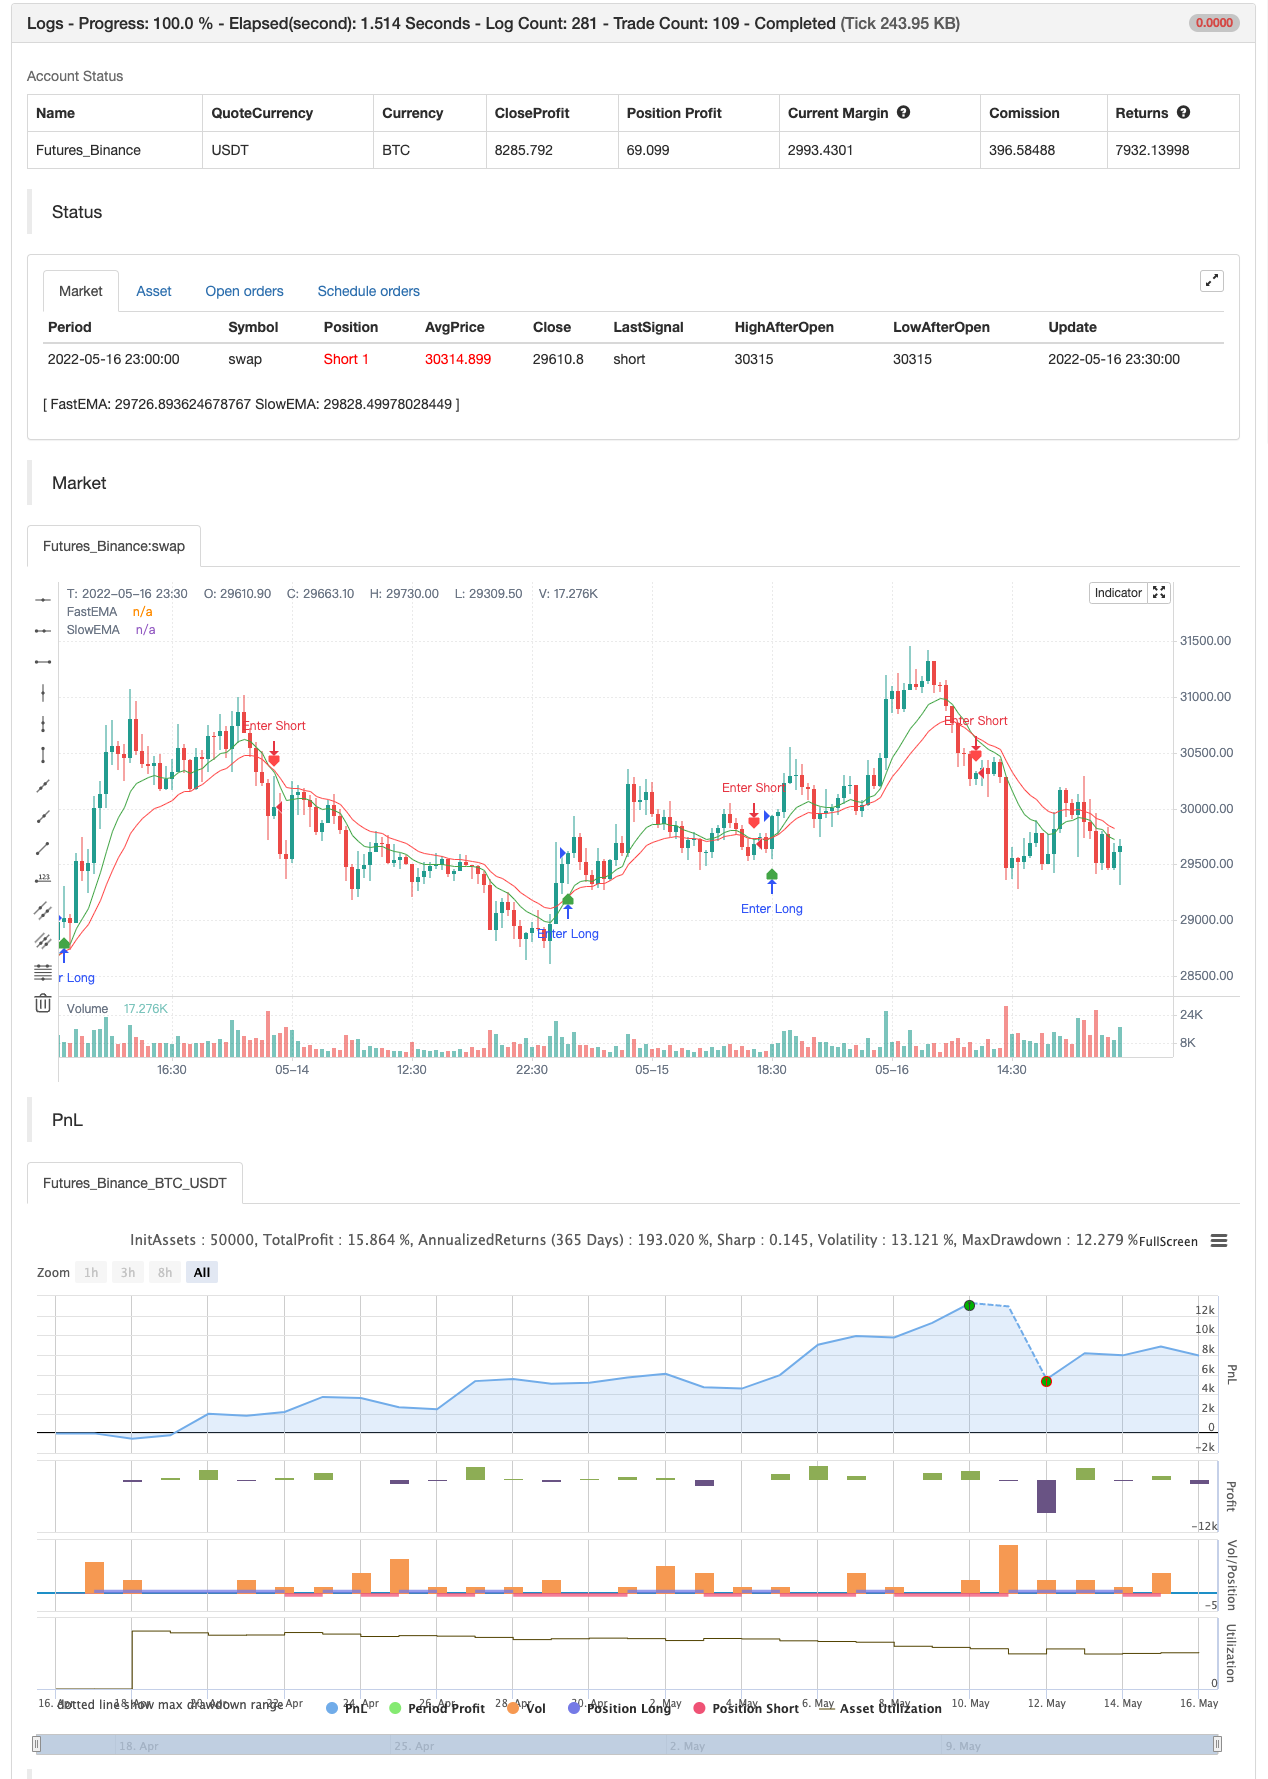
/*backtest
start: 2022-04-17 00:00:00
end: 2022-05-16 23:59:00
period: 30m
basePeriod: 15m
exchanges: [{"eid":"Futures_Binance","currency":"BTC_USDT"}]
args: [["v_input_1",10],["v_input_2",18]]
*/

// This source code is subject to the terms of the Mozilla Public License 2.0 at https://mozilla.org/MPL/2.0/
// © Ron Westbrook (discord: disturbinglymellow#4075)
// Date: 5/17/2021
// Description: Plots two exponential moving averages and places a colored cloud between to indicate trend direction. Default values of 9 and 20 periods have worked well for me, but inputs are available if you choose to change them. If you like my work and want to support more of it please consider leaving me a tip here. https://tinyurl.com/tipron


//@version=5
indicator(title='EMA TREND CLOUD', overlay=true)

fastLen = input(title='Fast EMA Length', defval=9)
slowLen = input(title='Slow EMA Length', defval=20)
useTextLabels = input.bool(true, title='Use Text-Based Crossover Labels?', group='Crossover Moving Averages')

fastEMA = ta.ema(close, fastLen)
slowEMA = ta.ema(close, slowLen)

fema = plot(fastEMA, title='FastEMA', color=color.new(color.green, 0), linewidth=1, style=plot.style_line)
sema = plot(slowEMA, title='SlowEMA', color=color.new(color.red, 0), linewidth=1, style=plot.style_line)

fill(fema, sema, color=fastEMA > slowEMA ? color.new(#417505, 50) : color.new(#890101, 50), title='Cloud')

// Bull and Bear Alerts
Bull = ta.crossover(fastEMA, slowEMA)
Bear = ta.crossunder(fastEMA, slowEMA)

plotshape(Bull, title='Calls Label', color=color.new(color.green, 25), textcolor=useTextLabels ? color.white : color.new(color.white, 100), style=useTextLabels ? shape.labelup : shape.triangleup, text='Calls', location=location.belowbar)

plotshape(Bear, title='Puts Label', color=color.new(color.red, 25), textcolor=useTextLabels ? color.white : color.new(color.white, 100), style=useTextLabels ? shape.labeldown : shape.triangledown, text='Puts', location=location.abovebar)


if Bull
    alert('Calls Alert: 9ema crossed over 20ema', alert.freq_once_per_bar_close)
if Bear
    alert('Puts Alert: 9ema crossed under 20ema', alert.freq_once_per_bar_close)


if Bull
    strategy.entry("Enter Long", strategy.long)
else if Bear
    strategy.entry("Enter Short", strategy.short)
関連性
- RSIと二重EMAのクロスオーバー・シグナル量的な戦略
- エリオット波理論 4-9 インパルス波自動検出 取引戦略
- KRK aDa ストーカスティック AI 強化の遅い平均逆転戦略
- EMA23/EMA50 ダブル移動平均のクロスオーバー量的な取引戦略
- MACD ゴールデンクロスとデスクロス戦略
- MACD-V と フィボナッチ 多期ダイナミック・テイク・プロフィート戦略
- 移動平均値とボリンジャー帯に基づいた定量的な取引戦略
- MACD BB ブレイクストラテジー
- Wavetrend 大幅のリバウンド・グリッド・トレード戦略
- MACDクロスオーバー戦略
- ZeroLag MACD ロングショート戦略
もっと
- ATR スムーズ化
- オーダーブロックファインダー
- トレンドスカルプ-フラクタルボックス-3EMA
- QQE信号
- U位格子振幅フィルタ
- CM MACD カスタム インディケーター - 複数のタイムフレーム - V2
- ホードルライン
- 2 移動平均色方向検知
- Scalping PullBack ツール R1
- 買・売戦略は AO+Stoch+RSI+ATRに依存する
- RedK ボリューム加速方向エネルギー比
- ドンチアン・ブレイク 塗装なし
- レッドKモメントバー
- スーパージャンプ バックボリンガー帯
- フクイズの傾向
- ジョニーのボット
- SSL ハイブリッド
- チェンデリア出口
- リゾット
- EMA クラウド・イントラデイ・戦略
ブクシアック