底覆い戦略
作成日:
2024-01-18 15:44:10
最終変更日:
2024-01-18 15:44:10
コピー:
2
クリック数:
748
1
フォロー
1750
フォロワー
概要
破盤回補戦略は,典型的な低買高売り戦略である. RSI指標を用いて超売り点を識別し,価格が一定程度下落した後に買い信号を発信し,より低い価格でトークンを蓄積する.価格が再び上昇すると,RSIが値下げから脱出することを設定することで,利潤が結束される. この戦略は,中長線保有に適用され,トークンの震動状況における偽突破を効果的にフィルタリングし,コイン保有コストの最適化を実現する.
戦略原則
この戦略は主にRSI指標に基づいて超売り点を識別する. RSI指標の正常な範囲は0から100の間である. RSI指標が設定された入場値35以下に下落すると,買入シグナルを発信する. RSI指標が設定された出場値65以上に再上昇すると,売りシグナルを発信する.
さらに,戦略は100サイクル単一の移動平均を導入し,RSI指標と組み合わせることで,価格が移動平均を下回るとのみ,RSIが超売り領域に入るとのみ,買入シグナルが誘発されます.これは,部分的な偽のブレイクを効果的にフィルターし,不要な取引を減らすことができます.
戦略的優位性
- RSIを利用して,超売りと超買点を効果的に識別し,逆転点で入場し,優良な買取コストを得ることができます.
- 移動平均のフィルターで誤差を回避する
- 中長線保有に適し,潜在的上昇トレンドを掘り下げることができる
戦略的リスクと解決策
- 遅延があるため,迅速な反転の機会を逃す可能性があります.
- RSIの計算周期を適切に短縮し,指標の反応を早める
- 金融危機の状況では,平仓の損失が増加する可能性がある.
- 移動平均の周期を調整するか,移動平均をキャンセルするか
- RSIの入出口パラメータを適切に緩和する
戦略最適化の方向性
- 異なる通貨とタイムサイクルパラメータの最適化をテストする
- MACD,ブリン・バンドなど
- RSIパラメータまたは移動平均パラメータを動的に調整する
- ポジション管理戦略の最適化
要約する
破盤補償戦略は,全体的に,安定して実用的な低買高売り戦略である.RSIと移動平均の二重フィルタリングにより,誤信号を効果的に抑制することができ,最適化されたパラメータの下で,より低いマネー保有コストを得ることができる.同時に,適切な指標パラメータを最適化し,ポジション戦略を調整すると,より高い資金使用効率を得ることが期待される.
ストラテジーソースコード
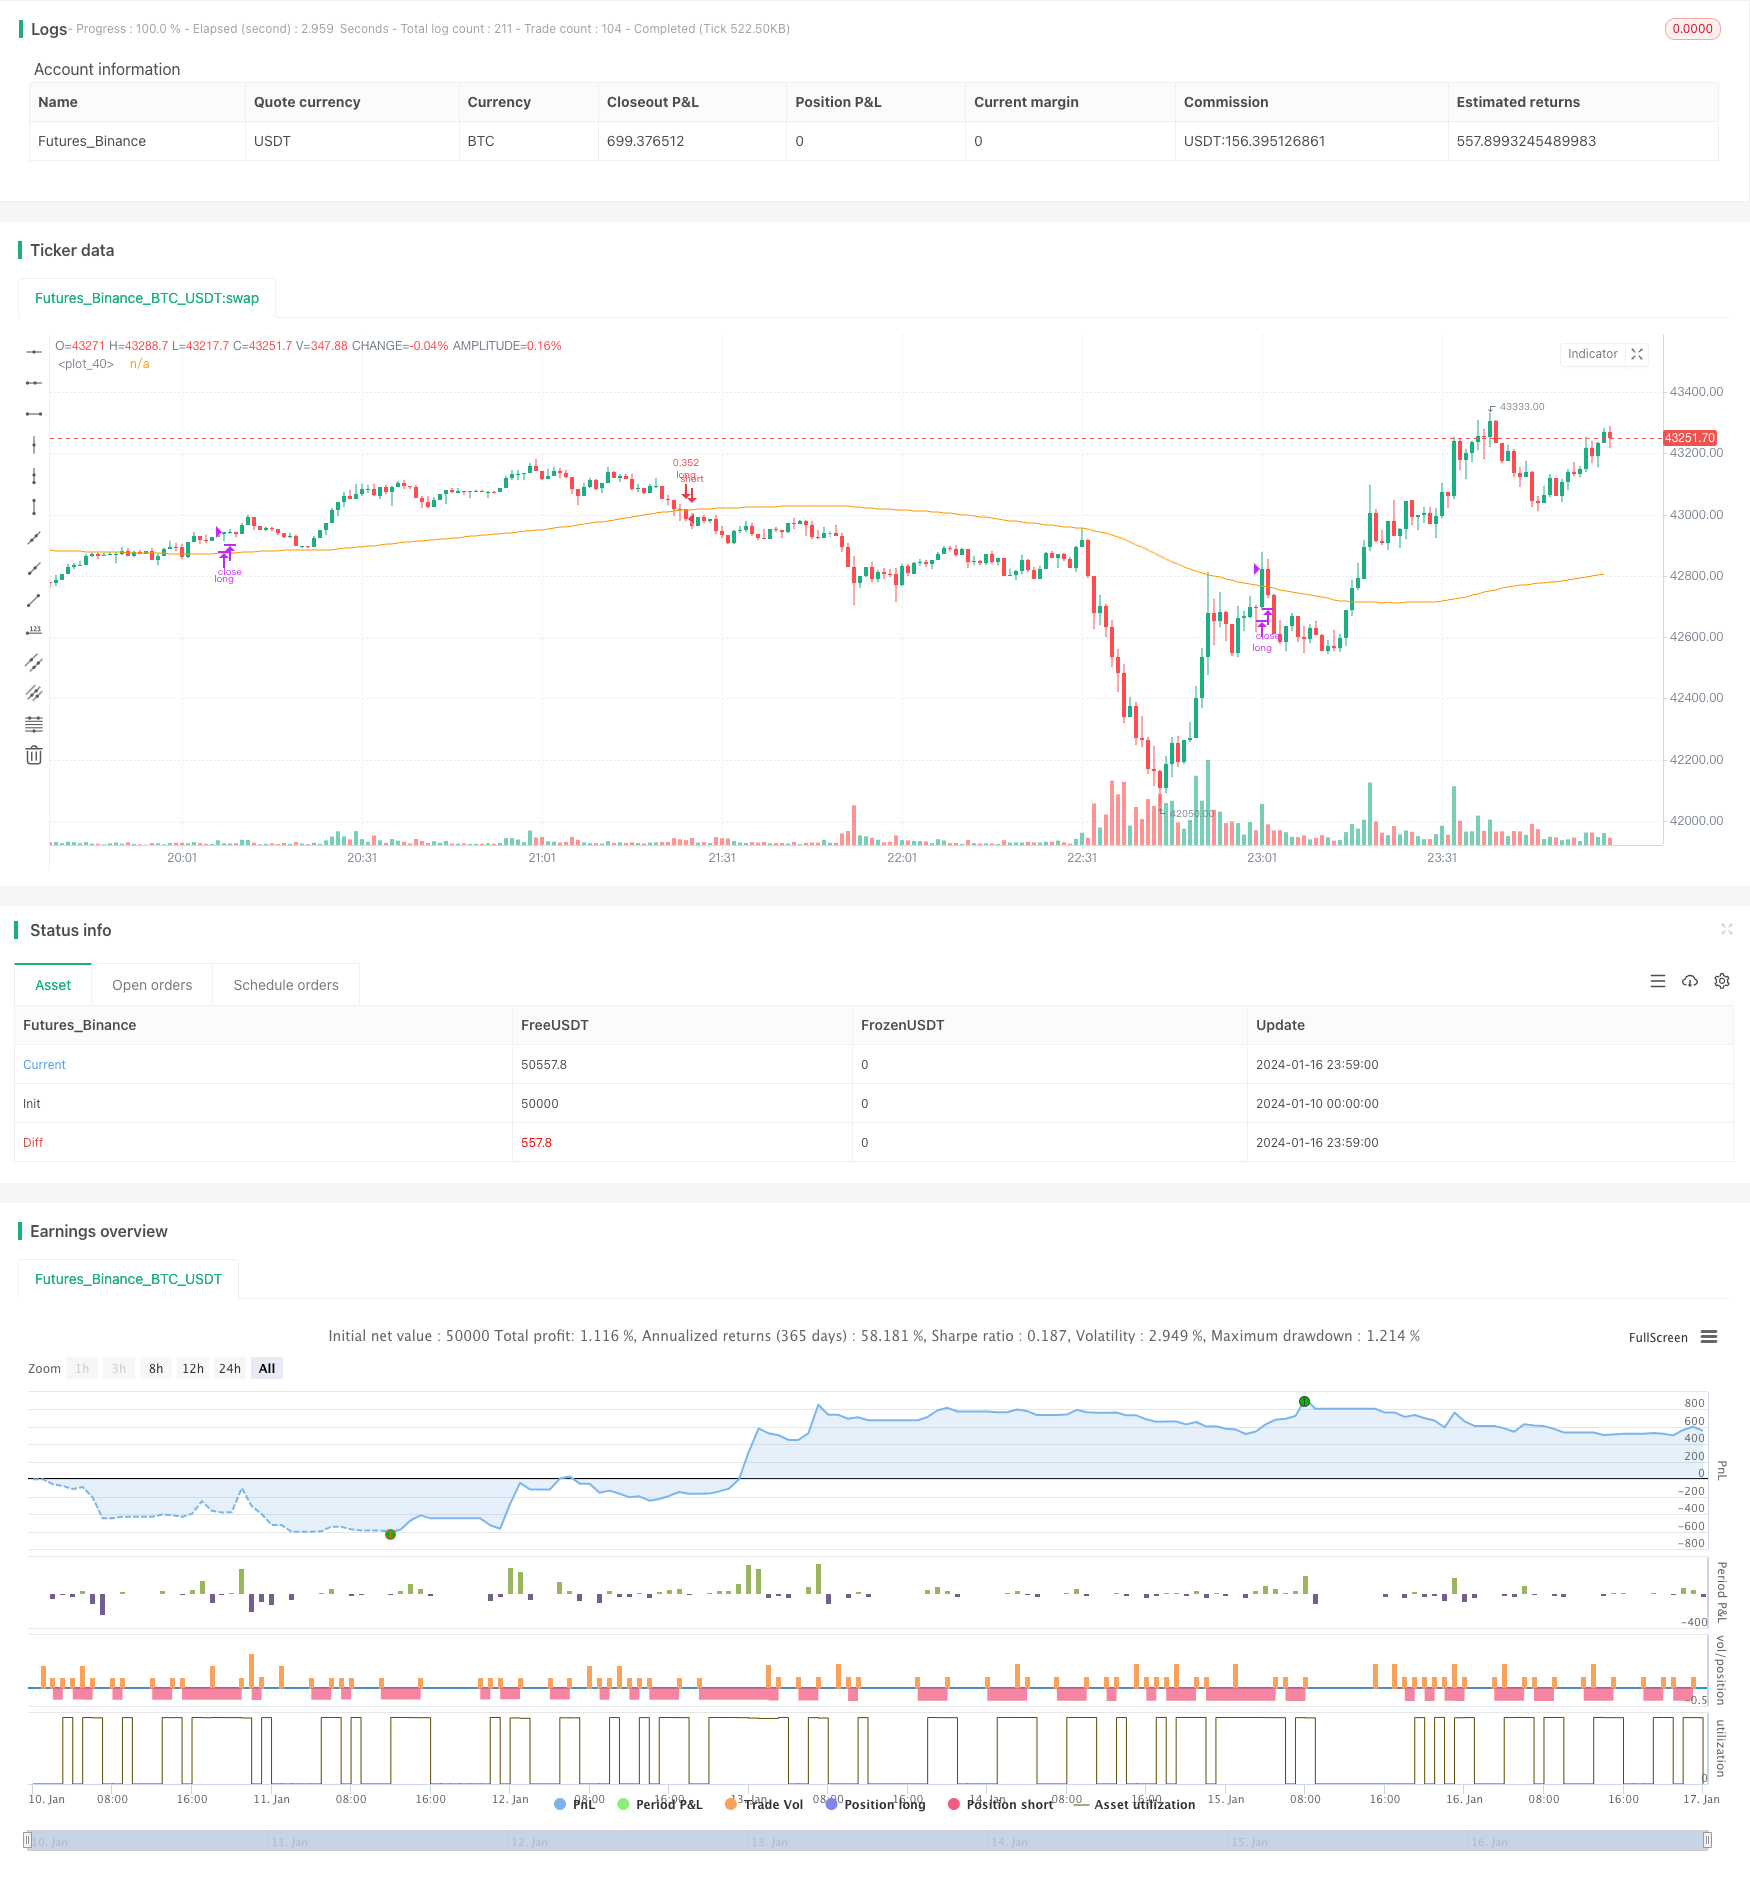
/*backtest
start: 2024-01-10 00:00:00
end: 2024-01-17 00:00:00
period: 1m
basePeriod: 1m
exchanges: [{"eid":"Futures_Binance","currency":"BTC_USDT"}]
*/

// This source code is subject to the terms of the Mozilla Public License 2.0 at https://mozilla.org/MPL/2.0/
// © Coinrule

//@version=4
strategy(shorttitle='Optimized RSI Strategy',title='Optimized RSI Strategy - Buy The Dips (by Coinrule)', overlay=true, initial_capital = 1000, default_qty_type = strategy.percent_of_equity, default_qty_type = strategy.percent_of_equity, default_qty_value = 30, commission_type=strategy.commission.percent, commission_value=0.1)

//Backtest dates
fromMonth = input(defval = 1,    title = "From Month",      type = input.integer, minval = 1, maxval = 12)
fromDay   = input(defval = 1,    title = "From Day",        type = input.integer, minval = 1, maxval = 31)
fromYear  = input(defval = 2020, title = "From Year",       type = input.integer, minval = 1970)
thruMonth = input(defval = 1,    title = "Thru Month",      type = input.integer, minval = 1, maxval = 12)
thruDay   = input(defval = 1,    title = "Thru Day",        type = input.integer, minval = 1, maxval = 31)
thruYear  = input(defval = 2112, title = "Thru Year",       type = input.integer, minval = 1970)

showDate  = input(defval = true, title = "Show Date Range", type = input.bool)

start     = timestamp(fromYear, fromMonth, fromDay, 00, 00)        // backtest start window
finish    = timestamp(thruYear, thruMonth, thruDay, 23, 59)        // backtest finish window
window()  => true       // create function "within window of time"


// RSI inputs and calculations
lengthRSI = (14)
RSI = rsi(close, lengthRSI)

RSI_entry = input(35, title = 'RSI Entry', minval=1)
RSI_exit = input(65, title = 'RSI Close', minval=1)

//Calculate Moving Averages
movingaverage_signal = sma(close, input(100))

//Entry
strategy.entry(id="long", long = true, when = RSI< RSI_entry and close < movingaverage_signal and window())

//Exit
//RSI
strategy.close("long", when = RSI > RSI_exit and window())

plot (movingaverage_signal)