zdmre의 RSI
저자:차오장, 날짜: 2022-05-13 16:34:43태그:RMA
전통적 해석 및 RSI 사용은 70 이상의 값이 증권이 과잉 매입되거나 과대 평가되는 것을 암시하며 트렌드 역전 또는 교정 가격 인하에 대비 될 수 있다고 주장합니다. RSI 30 또는 그 이하의 판독은 과대 판매 또는 과대 평가 된 상태를 나타냅니다.
30 = 과잉 판매 70 = 과잉 구매
제안에 감사합니다 @DieGobelMonte
백테스트
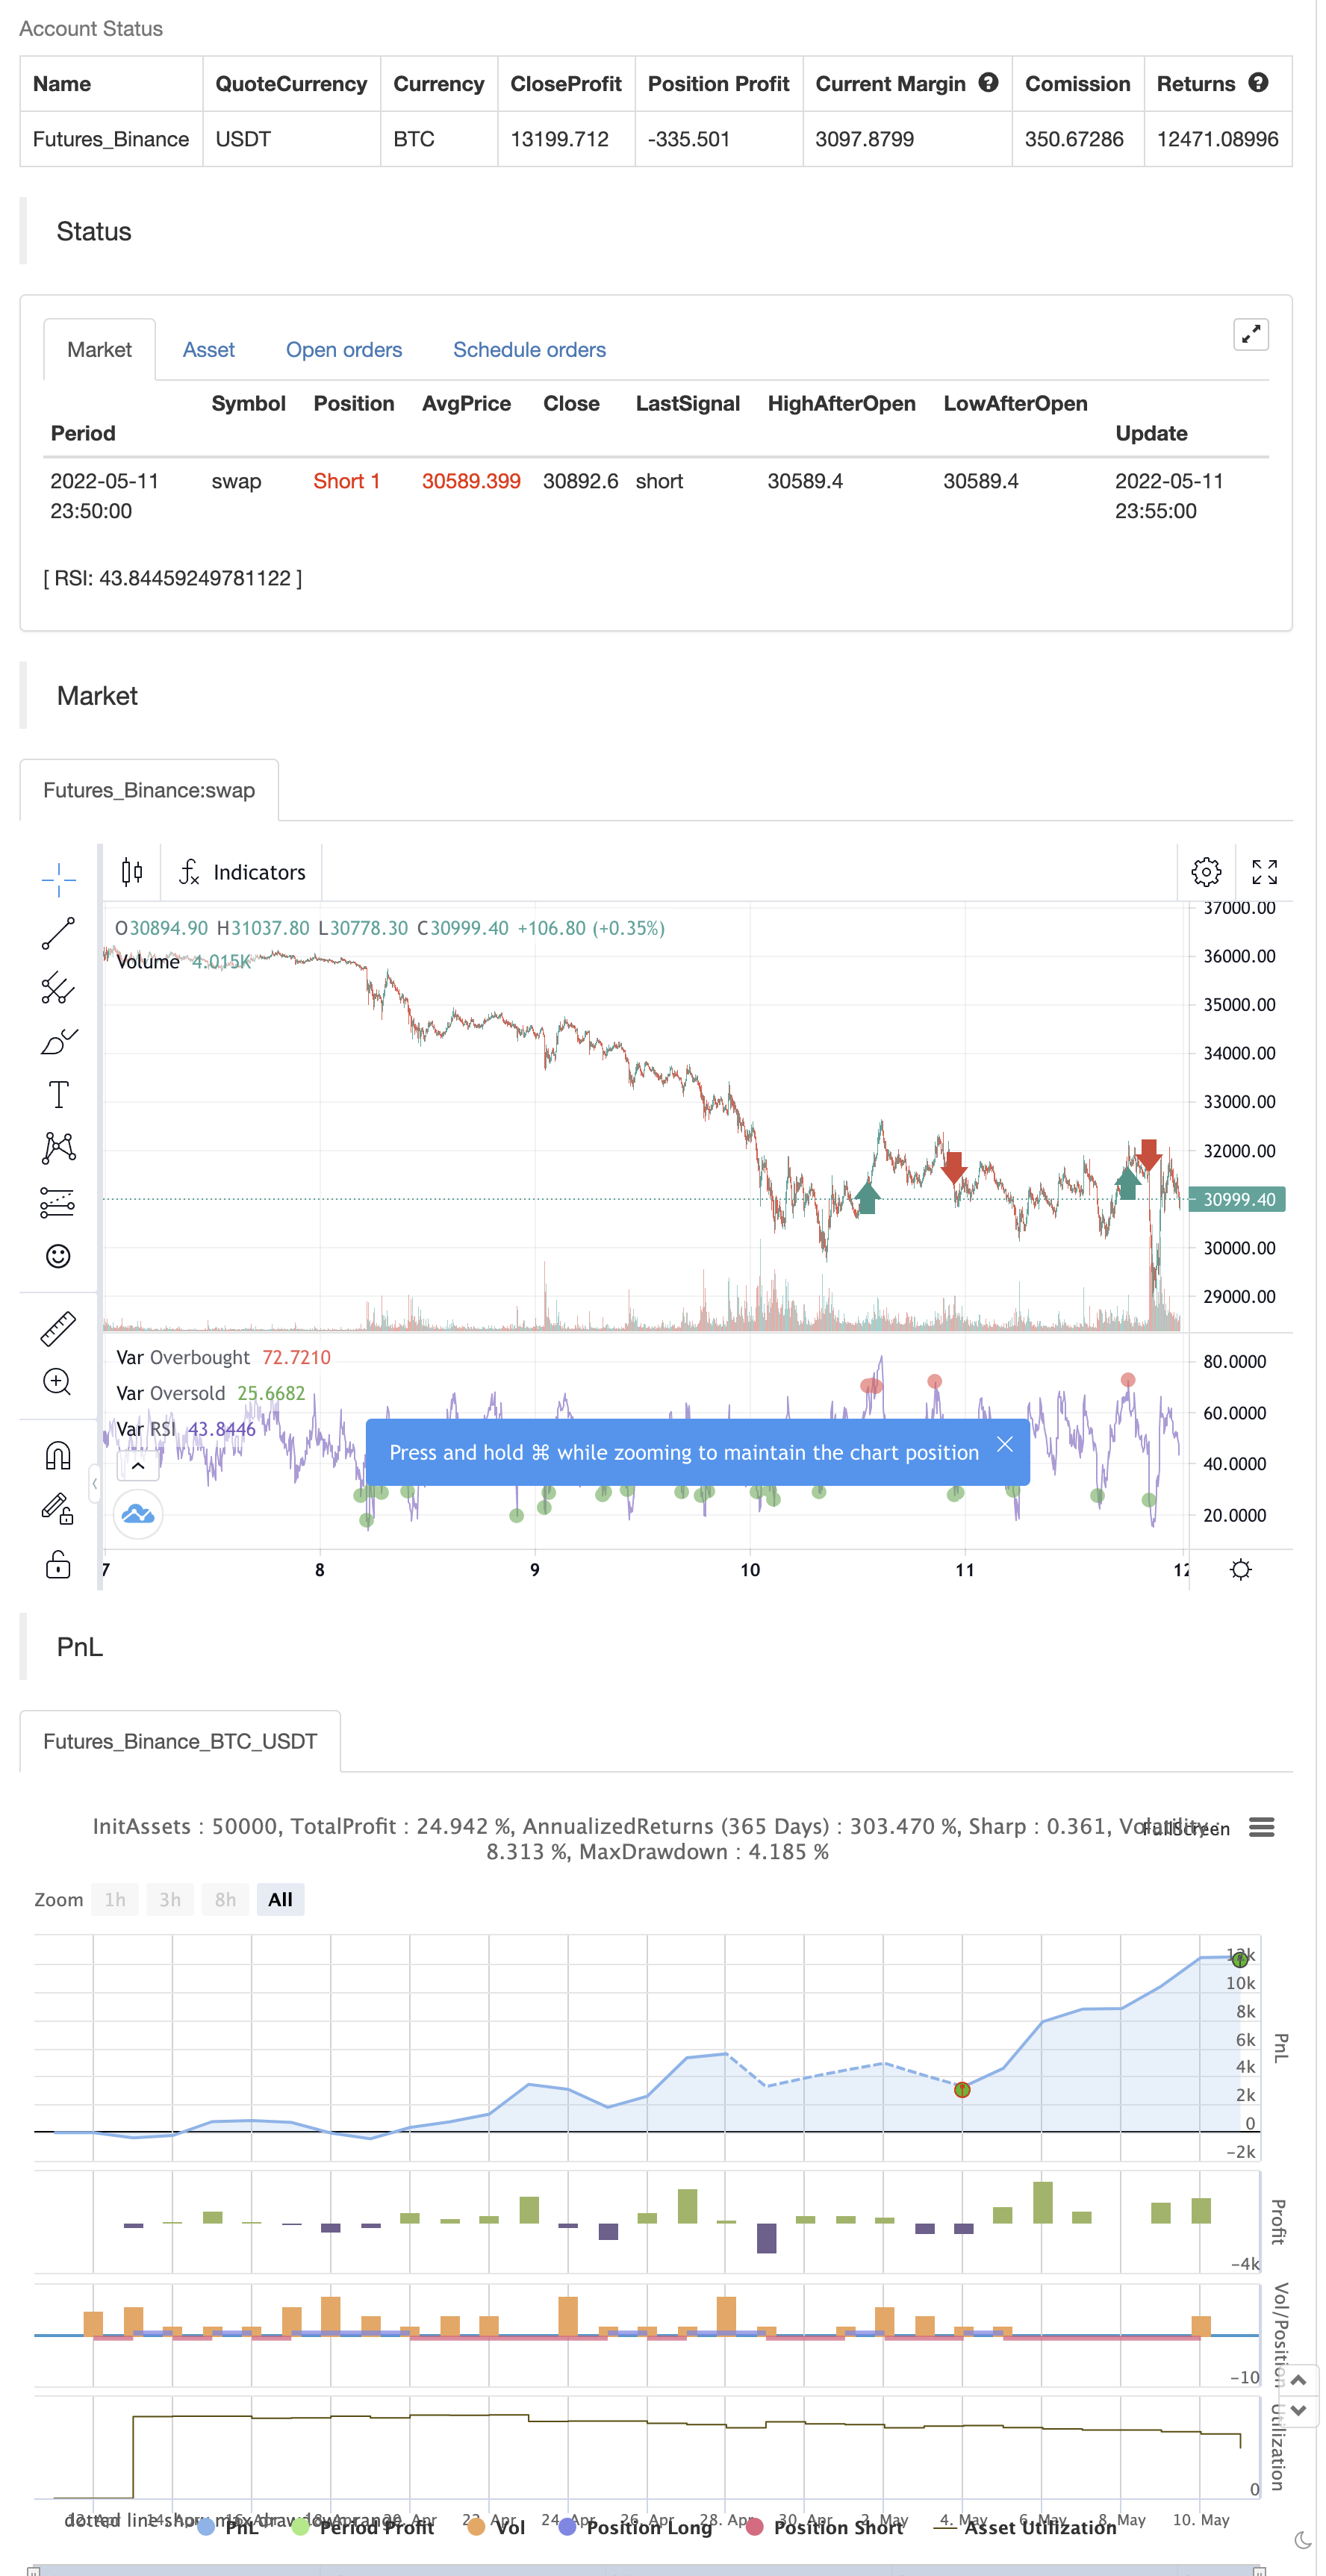
/*backtest
start: 2022-04-12 00:00:00
end: 2022-05-11 23:59:00
period: 5m
basePeriod: 1m
exchanges: [{"eid":"Futures_Binance","currency":"BTC_USDT"}]
*/

// This source code is subject to the terms of the Mozilla Public License 2.0 at https://mozilla.org/MPL/2.0/
// © zdmre

//@version=5
indicator("RSI by zdmre", overlay=false)

len = input.int(14, minval=1, title='Length')
src = input(close, 'Source')
up = ta.rma(math.max(ta.change(src), 0), len)
down = ta.rma(-math.min(ta.change(src), 0), len)
rsi = down == 0 ? 100 : up == 0 ? 0 : 100 - 100 / (1 + up / down)
plot(rsi, 'RSI', color=color.new(#7E57C2, 0))
band1 = hline(70, "Upper Band", color=#787B86)
bandm = hline(50, "Middle Band", color=color.new(#787B86, 50))
band0 = hline(30, "Lower Band", color=#787B86)
fill(band1, band0, color=color.rgb(126, 87, 194, 90), title="Background")

ob= ta.cross(rsi, 70) == 1 and rsi >= 70
os = ta.cross(rsi, 30) == 1 and rsi <= 30

plot(ob ? rsi : na ,title='Overbought', style=plot.style_circles, color=color.new(color.red, 0), linewidth=5)
plot(os ? rsi : na ,title='Oversold ', style=plot.style_circles, color=color.new(color.green, 0), linewidth=5)

if ob
    strategy.entry("Enter Long", strategy.long)
else if os
    strategy.entry("Enter Short", strategy.short)
관련
- 피보나치 트렌드 역전 전략
- VWMA-ADX 모멘텀 및 트렌드 기반 비트코인 장기 전략
- 구매/판매로 EMA ADX RSI를 스칼핑
- FTSMA - 트렌드는 당신의 친구입니다
- 흠 이 없는 승리 전략
- 가장 좋은 삼키기 + 탈출 전략
- 슈퍼 스칼퍼 - 5분 15분
- 슈퍼 점프 턴 백 볼링거 밴드
- 후쿠이즈 트렌드
- SSL 하이브리드
- 모멘텀 기반의 지그자그
더 많은
- 시드 보스
- 회전점 높은 낮은 멀티 시간 프레임
- 유령 트렌드 추적 전략 데이터베이스
- 유령 트렌드 추적 전략 비즈니스 데이터베이스
- 유령 트렌드 추적 전략
- 레인보우 오시레이터
- 주식 곡선 위치 사이징 거래 예제
- KLineChart 데모
- 빌라 다이내믹 피보트 슈퍼트렌드 전략
- 크롤의 슈퍼트렌드
- FTL - 범위 필터 X2 + EMA + UO
- 브라마스트라
- 모보 밴드
- SAR + 3SMMA와 SL & TP
- SSS
- 달 발사 경고 템플릿 [지표]
- HALFTREND + HEMA + SMA (거짓 신호의 전략)
- RSI: 피보트, BB, SMA, EMA, SMMA, WMA, VWMA와의 분차
- RSI와 BB와 동시에 과판
- 롤링 하이킨 아시 촛불