EMA 트렌드 클라우드
저자:차오장, 날짜: 2022-05-18 15:32:51태그:EMA
이것은 거래 조언이 아닙니다. 보증은 없습니다. 자신의 위험에 사용하십시오.
9 및 20 기간 기하급수적 이동 평균 (EMA) 을 그래프화하고 그 사이에 구름을 칠하여 내일 트렌드와 그 강도를 시각적으로 식별합니다. 긴 녹색 구름, 짧은 빨간색 구름. 구름이 두꺼워질수록 트렌드가 강합니다. 긴 플레이 엔트리는 9 EMA가 20 EMA를 넘어서 구름이 녹색으로 변하게 만들 때입니다.
공격적인 엔트리는 크로스 발생을 유발하는 바의 닫기에 있습니다. 보수적인 엔트리는 크로스 다음 두 번째 바가 9 EMA 이상으로 닫히고 플레이 방향에있을 때입니다.
출입은 가격이 클라우드 또는 클라우드의 반대편에서 닫을 때 또는 평균이 거래의 반대 방향으로 교차 할 때 개인의 위험 용도에 따라 발생할 수 있습니다.
이것은 거래 조언이 아닙니다. 보증은 없습니다. 자신의 위험에 사용하십시오.
백테스트
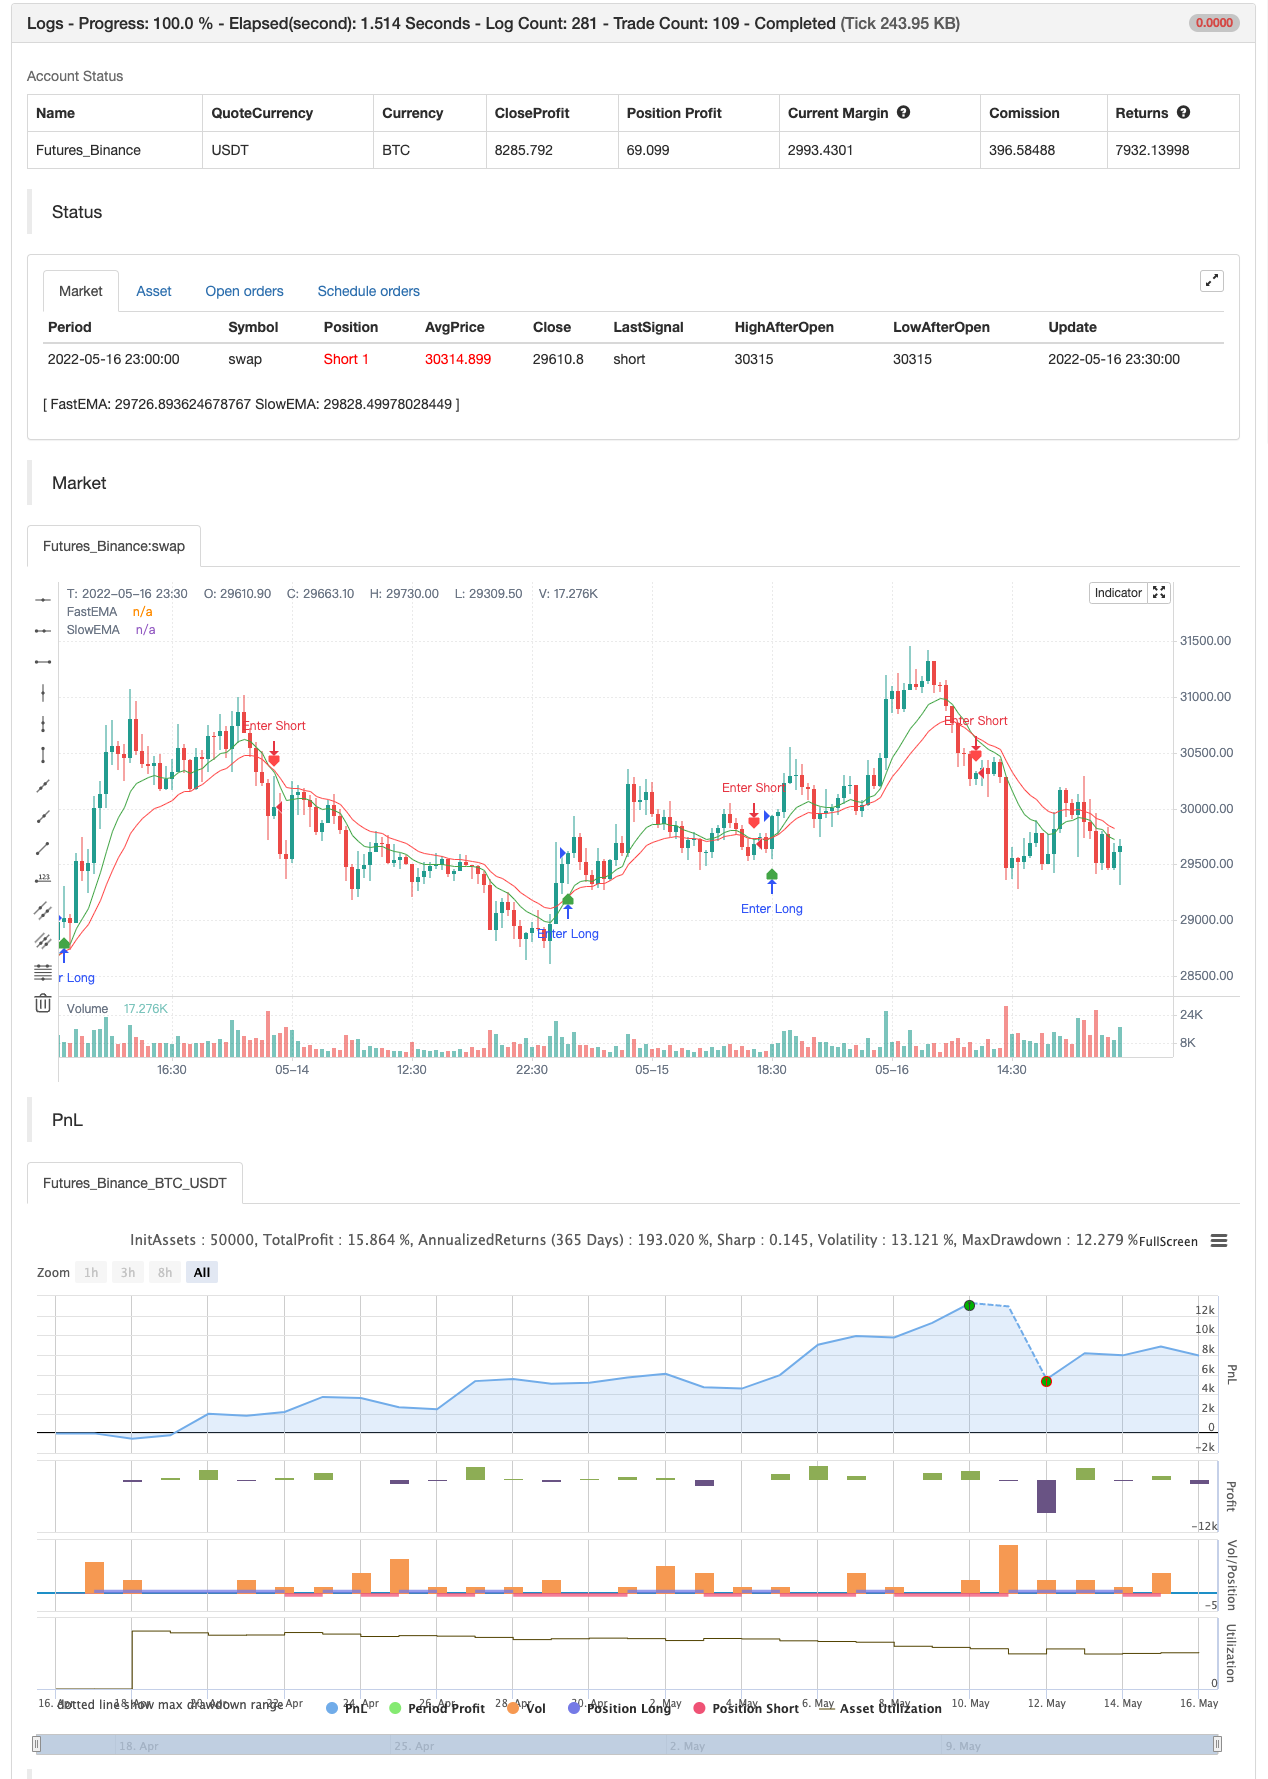
/*backtest
start: 2022-04-17 00:00:00
end: 2022-05-16 23:59:00
period: 30m
basePeriod: 15m
exchanges: [{"eid":"Futures_Binance","currency":"BTC_USDT"}]
args: [["v_input_1",10],["v_input_2",18]]
*/

// This source code is subject to the terms of the Mozilla Public License 2.0 at https://mozilla.org/MPL/2.0/
// © Ron Westbrook (discord: disturbinglymellow#4075)
// Date: 5/17/2021
// Description: Plots two exponential moving averages and places a colored cloud between to indicate trend direction. Default values of 9 and 20 periods have worked well for me, but inputs are available if you choose to change them. If you like my work and want to support more of it please consider leaving me a tip here. https://tinyurl.com/tipron


//@version=5
indicator(title='EMA TREND CLOUD', overlay=true)

fastLen = input(title='Fast EMA Length', defval=9)
slowLen = input(title='Slow EMA Length', defval=20)
useTextLabels = input.bool(true, title='Use Text-Based Crossover Labels?', group='Crossover Moving Averages')

fastEMA = ta.ema(close, fastLen)
slowEMA = ta.ema(close, slowLen)

fema = plot(fastEMA, title='FastEMA', color=color.new(color.green, 0), linewidth=1, style=plot.style_line)
sema = plot(slowEMA, title='SlowEMA', color=color.new(color.red, 0), linewidth=1, style=plot.style_line)

fill(fema, sema, color=fastEMA > slowEMA ? color.new(#417505, 50) : color.new(#890101, 50), title='Cloud')

// Bull and Bear Alerts
Bull = ta.crossover(fastEMA, slowEMA)
Bear = ta.crossunder(fastEMA, slowEMA)

plotshape(Bull, title='Calls Label', color=color.new(color.green, 25), textcolor=useTextLabels ? color.white : color.new(color.white, 100), style=useTextLabels ? shape.labelup : shape.triangleup, text='Calls', location=location.belowbar)

plotshape(Bear, title='Puts Label', color=color.new(color.red, 25), textcolor=useTextLabels ? color.white : color.new(color.white, 100), style=useTextLabels ? shape.labeldown : shape.triangledown, text='Puts', location=location.abovebar)


if Bull
    alert('Calls Alert: 9ema crossed over 20ema', alert.freq_once_per_bar_close)
if Bear
    alert('Puts Alert: 9ema crossed under 20ema', alert.freq_once_per_bar_close)


if Bull
    strategy.entry("Enter Long", strategy.long)
else if Bear
    strategy.entry("Enter Short", strategy.short)
관련
- RSI와 듀얼 EMA 크로스오버 신호 양적 전략
- 엘리엇 파동 이론 4-9 충동 파동 자동 탐지 거래 전략
- KRK aDa AI 향상과 함께 스토카스틱 느린 평균 반전 전략
- EMA23/EMA50 이중 이동 평균 크로스오버 양적 거래 전략
- MACD 골든 크로스와 데스 크로스 전략
- MACD-V 및 피보나치 다중 시간 프레임 동적 영업 전략
- 이동 평균과 볼린거 대역에 기초한 양적 거래 전략
- MACD BB 브레이크업 전략
- 웨이브트렌드 대폭 과판 리바운드 그리드 거래 전략
- MACD 크로스오버 전략
- 제로래그 MACD 긴 짧은 전략
더 많은
- ATR 평평화
- 주문 블록 검색어
- 트렌드 스칼프-프랙탈박스-3EMA
- QQE 신호
- U비트 격자 팽창 필터링
- CM MACD 사용자 지정 지표 - 여러 시간 프레임 - V2
- HODL 라인
- 2 이동 평균 색 방향 탐지
- Scalping PullBack 도구 R1
- 매수 전략은 AO+Stoch+RSI+ATR에 달려 있습니다.
- RedK 부피 가속 방향 에너지 비율
- 돈치안 브레이크아웃
- 레드K 모멘텀 바
- 슈퍼 점프 턴 백 볼링거 밴드
- 후쿠이즈 트렌드
- 조니의 BOT
- SSL 하이브리드
- 캔들리어 출구
- 리소토
- EMA 클라우드 내일 전략