개요
이 전략은 지수 이동 평균과 Chande 동적 집합 분산 평균의 실제 범위를 사용하여 잠재적인 추세 반전 또는 지속을 발견하기 위해 고안되었습니다. 이 전략은 여러 지표와 결합하여 진입 시기를 판단하고 시장의 변동성에 따라 중지 및 중지 수준을 설정하여 새로운 추세를 발견하면서 위험을 통제하려고합니다.
전략 원칙
이 전략은 60주기 및 90주기 이중 EMA를 사용하여 트렌드 방향을 판단한다. 짧은 주기 EMA에 긴 주기 EMA를 가로질렀을 때 포지션 신호이다. 또한 MACD의 빠른 라인에서 느린 라인을 가로질러 포지션을 확인할 수 있다. 진입 시에는 CDC가 이전에 계산한 파동 정지점보다 높은 가격을 요구한다.
전략적 출전 규칙은: 가격이 ATR 기반의 정지 지점을 만지거나 CDC를 넘어서는 경우 정지 지점을 벗어나는 경우 청산한다.
우위 분석
이 전략은 쌍 EMA 판단 주 트렌드 방향과 MACD 확인 입시 시기를 결합하여 가짜 돌파구를 방지합니다. 이동 중지 위치와 정지 위치 모두 시장의 변동성에 기반하여 위험을 잘 관리 할 수 있습니다. 추세가 반전되거나 지속되는지 여부에 관계없이 이 전략은 적시에 기회를 잡을 수 있습니다.
또한, 이 전략의 입력 매개 변수는 사용자 정의할 수 있으며, 사용자는 필요에 따라 EMA 주기, ATR 주기 및 CDC 계수 등을 조정하여 전략을 자신의 거래 방식에 더 적합하게 만들 수 있다.
위험 분석
이 전략의 가장 큰 위험은 트렌드를 잘못 판단하는 데 있습니다. 시장이 회수되는 동안 EMA는 잘못된 신호를 발산할 수 있습니다. 이 때 MACD 지표의 확인 역할은 특히 중요합니다. 또한, 갑작스러운 사건으로 인한 큰 폭행을 대응하기 위해 CDC 스톱저스 인자를 적절히 확대해야합니다.
최적화 방향
- 테스트 EMA 주기 변수를 조정하여 최적의 변수 조합을 찾습니다.
- 다른 CDC의 정지수 크기를 테스트합니다.
- 다른 지표와 함께 출전 시간을 필터링해 보세요.
- 긴급한 사건에 대한 처리 메커니즘을 강화합니다.
요약하다
이 전략은 트렌드 판단과 변동성 지표의 장점을 최대한 활용하여 시중 증권에서 잠재적인 기회를 식별 할 수 있습니다. 이 전략은 매개 변수 최적화 및 메커니즘 개선으로 안정성과 수익성을 더욱 향상시킬 수 있습니다.
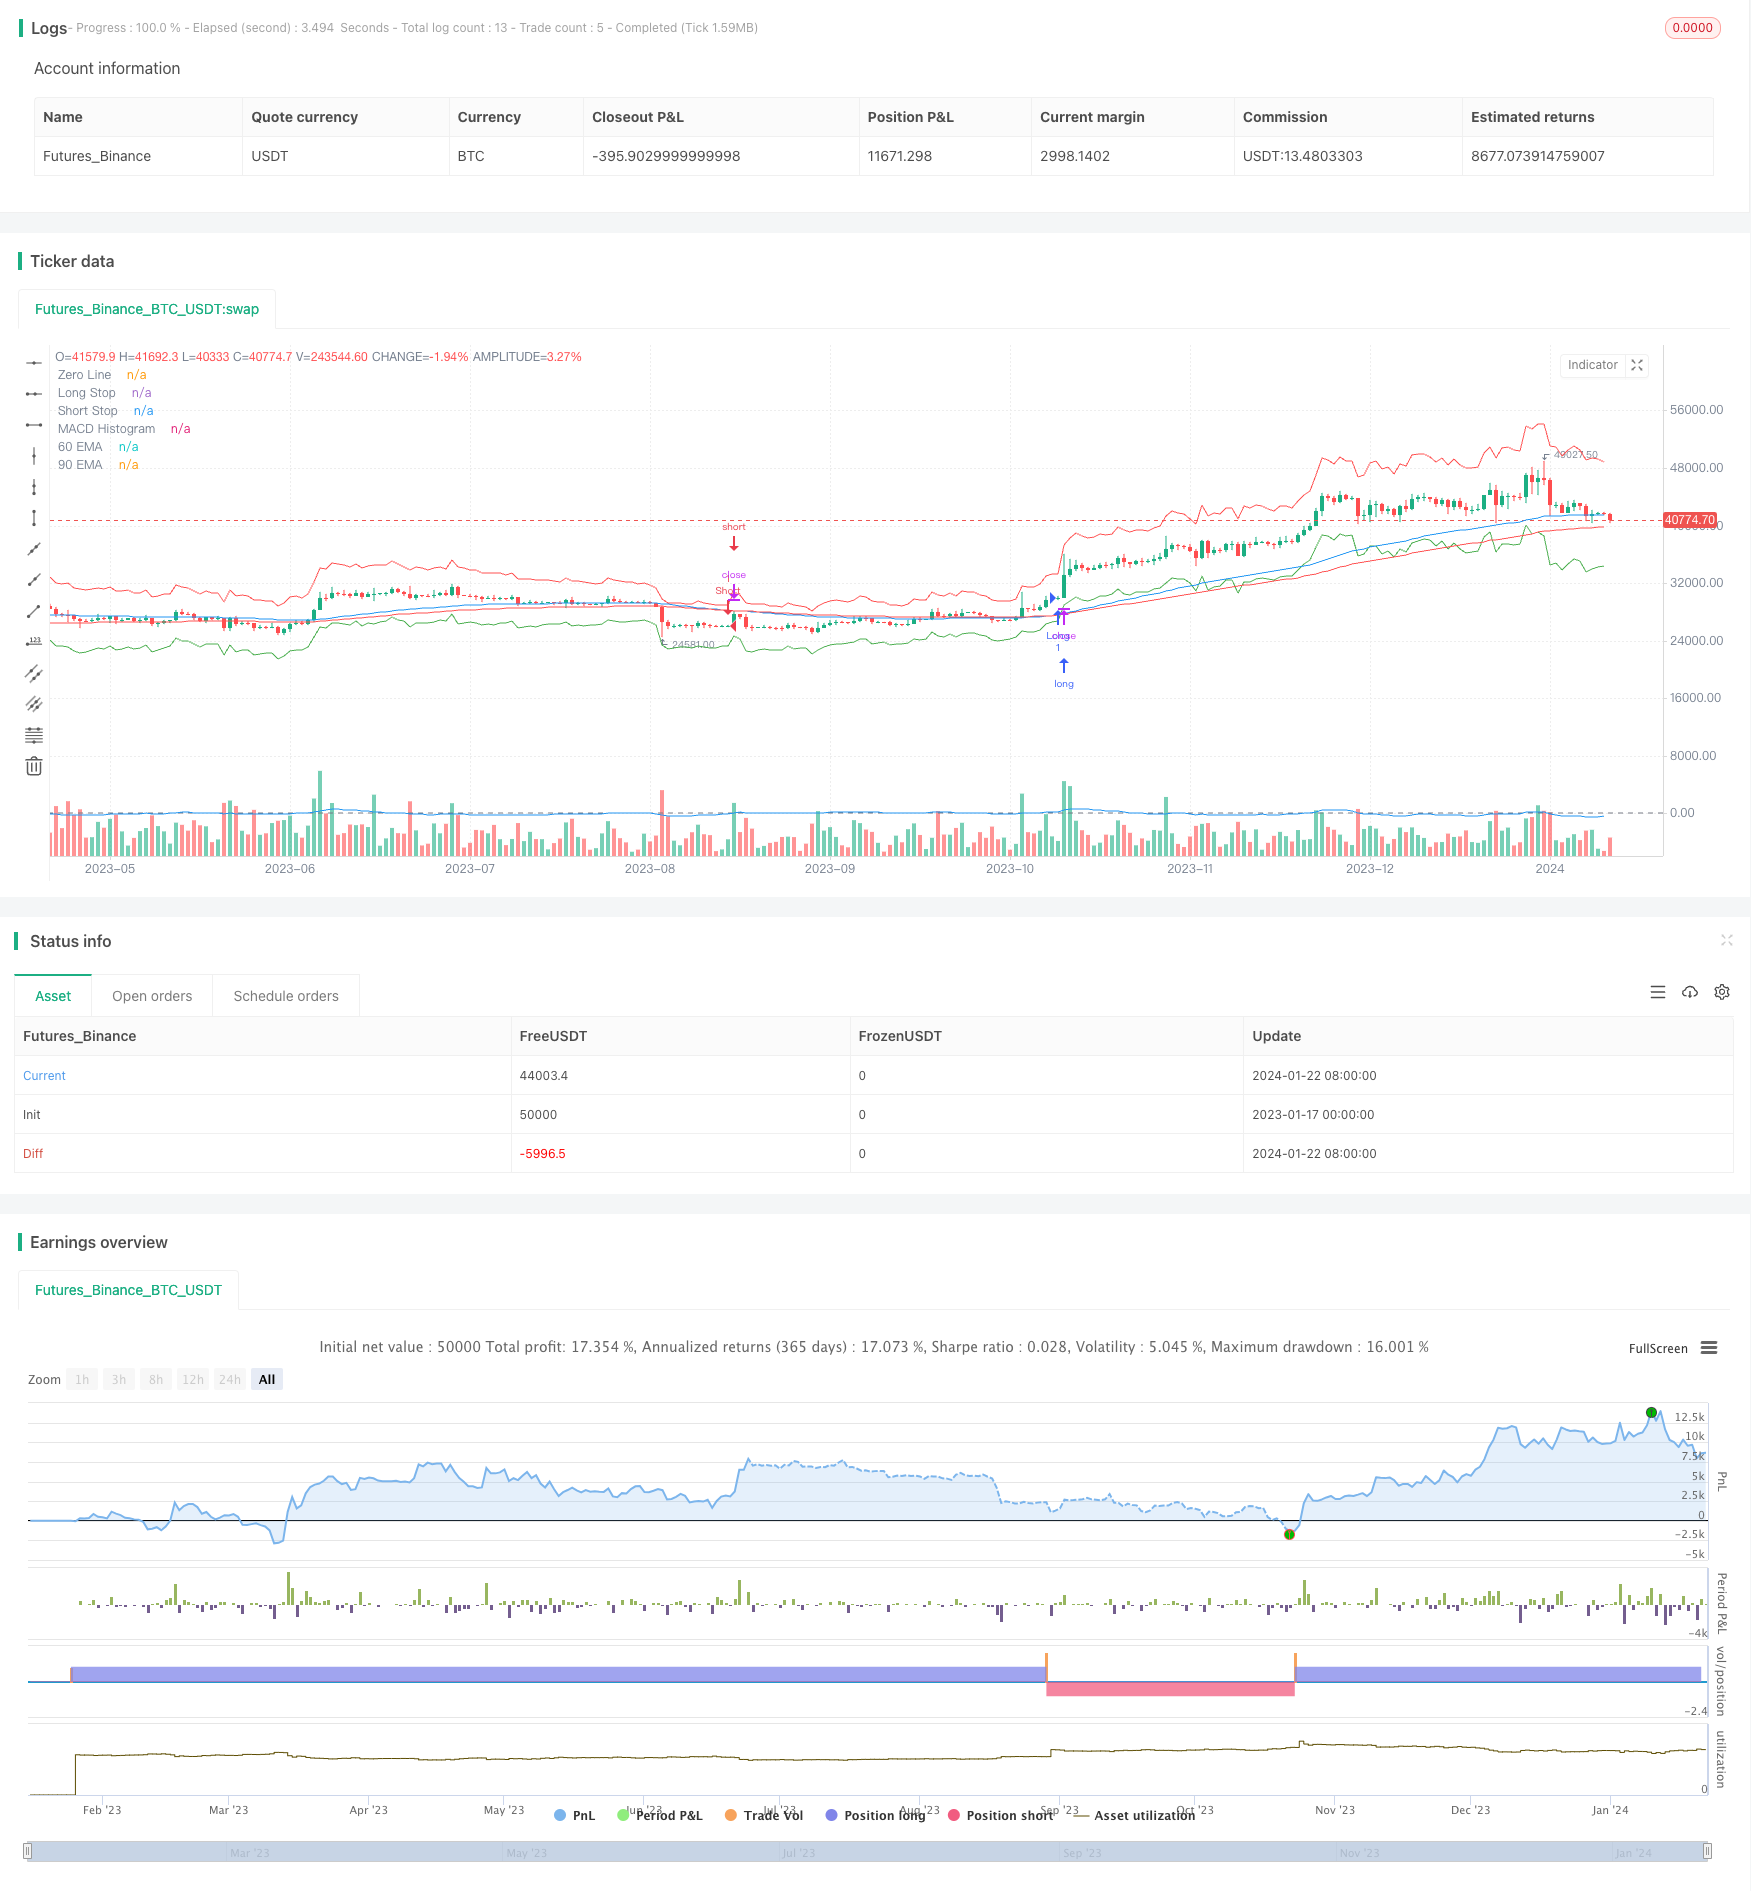
/*backtest
start: 2023-01-17 00:00:00
end: 2024-01-23 00:00:00
period: 1d
basePeriod: 1h
exchanges: [{"eid":"Futures_Binance","currency":"BTC_USDT"}]
*/

//@version=5
strategy("Improved EMA & CDC Trailing Stop Strategy", overlay=true)

// Define the inputs
ema60Period = input(60, title="EMA 60 Period")
ema90Period = input(90, title="EMA 90 Period")
atrPeriod = input(24, title="CDC ATR Period")
multiplier = input(4.0, title="CDC Multiplier")
profitTargetMultiplier = input(2.0, title="Profit Target Multiplier (ATR)")

// Calculate EMAs
ema60 = ta.ema(close, ema60Period)
ema90 = ta.ema(close, ema90Period)

// Calculate ATR
atr = ta.atr(atrPeriod)

// MACD calculation
[macdLine, signalLine, _] = ta.macd(close, 12, 26, 9)

// Define the trailing stop and profit target
longStop = close - multiplier * atr
shortStop = close + multiplier * atr
longProfitTarget = close + profitTargetMultiplier * atr
shortProfitTarget = close - profitTargetMultiplier * atr

// Entry conditions
longCondition = close > ema60 and ema60 > ema90 and macdLine > signalLine and close > longStop
shortCondition = close < ema60 and ema60 < ema90 and macdLine < signalLine and close < shortStop

// Exit conditions based on profit target
longProfitCondition = close >= longProfitTarget
shortProfitCondition = close <= shortProfitTarget

// Plot the EMAs, Stops, and MACD for visualization
plot(ema60, color=color.blue, title="60 EMA")
plot(ema90, color=color.red, title="90 EMA")
plot(longStop, color=color.green, title="Long Stop", style=plot.style_linebr)
plot(shortStop, color=color.red, title="Short Stop", style=plot.style_linebr)
hline(0, "Zero Line", color=color.gray)
plot(macdLine - signalLine, color=color.blue, title="MACD Histogram")

// Strategy execution using conditional blocks
if longCondition
    strategy.entry("Long", strategy.long)
if shortCondition
    strategy.entry("Short", strategy.short)

// Exit based on profit target and trailing stop
if longProfitCondition or close < longStop
    strategy.close("Long")
if shortProfitCondition or close > shortStop
    strategy.close("Short")