개요
실제 상대 운동 MA 평균 전략 (TRMMA) 은 상대적으로 약한 지수 (RSI) 와 실제 강한 지수 (TSI) 를 결합한 트렌드 추적 전략이다. 그것은 RSI와 TSI의 지표를 구매 및 판매 신호로 사용하여 이동 평균을 보조하여 전략 최적화를 한다.
전략 원칙
이 전략은 다음과 같은 부분으로 구성됩니다.
TSI 계산 이중 지수 평준화를 통해 가격 변화율의 지수 평준화를 계산하고, 가격 변화율의 절대값으로 지수 평준화를 나눈 다음 TSI 지표를 얻는다. 이 중 장기간은 25일, 단기간은 5일, 신호선은 14일이다.
RSI 계산 RSI 지표의 길이는 5입니다.
신호 판단 TSI가 신호선을 통과하고 RSI가 50을 통과하면 구매 신호입니다. TSI가 신호선을 통과하고 RSI가 50을 통과하면 판매 신호입니다.
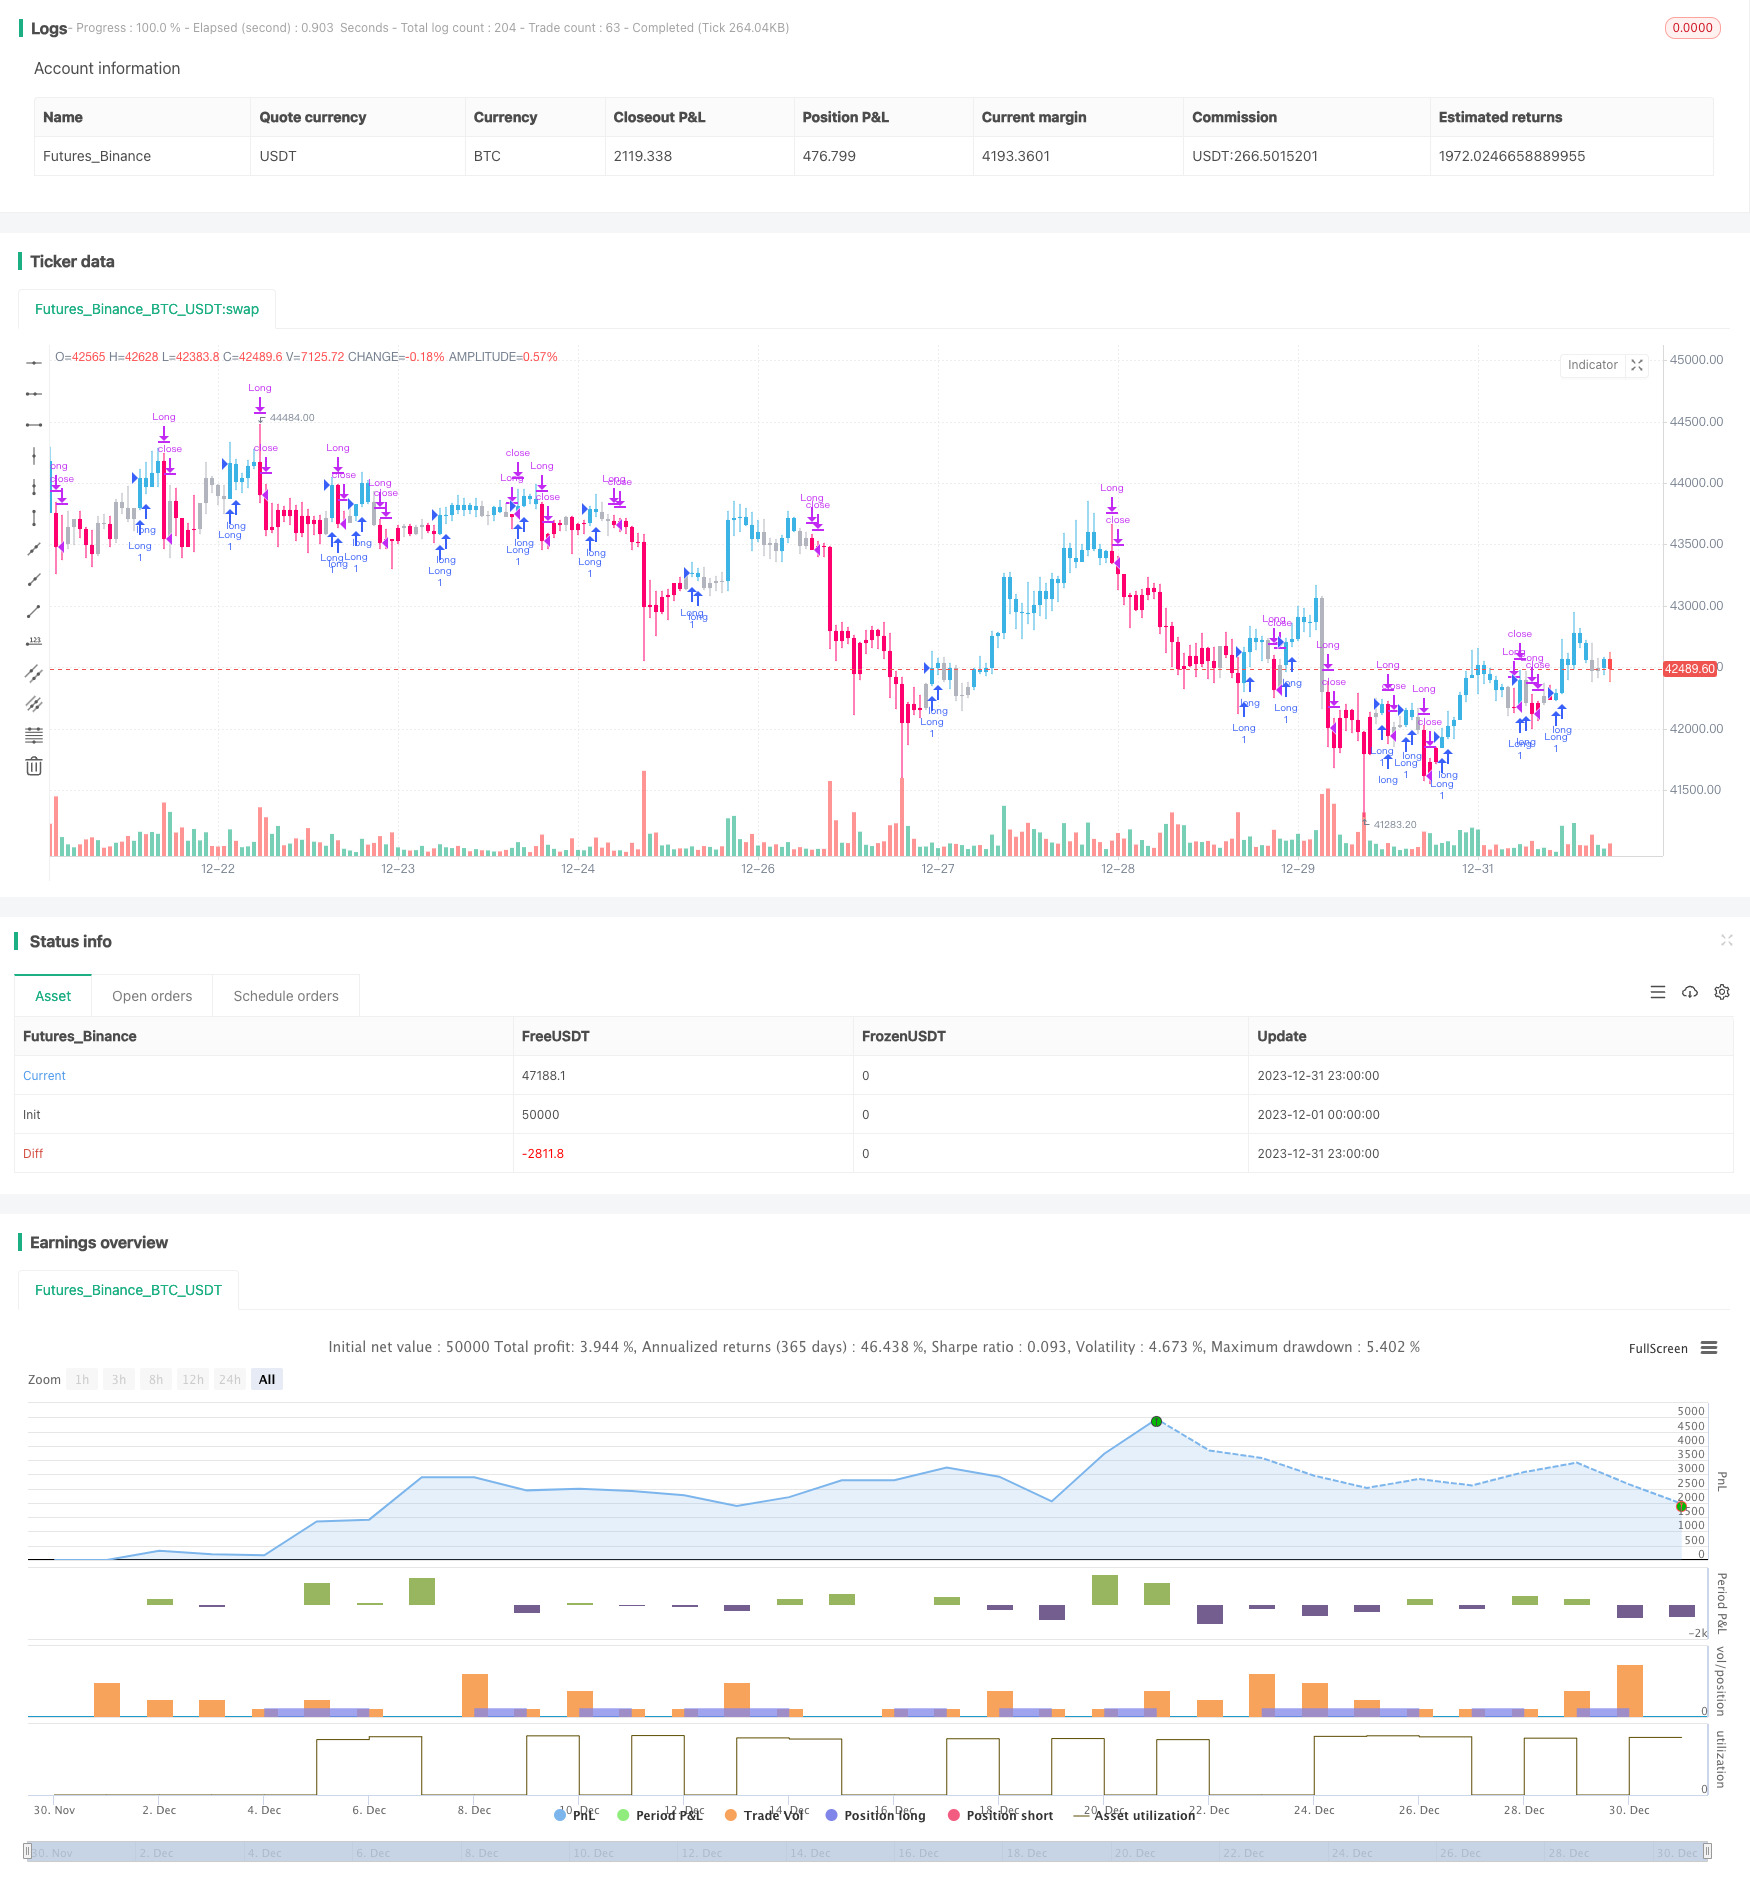
K선 색상 신호 판단에 따라 K선을 염색, 보조 판단.
전략 매개변수 포지션 비율과 자금 등의 파라미터를 설정한다.
우위 분석
이 전략은 TSI와 RSI의 두 지표를 결합하여 시장의 추세와 과매매 과매매 상황을 효과적으로 판단하여 거래 신호를 생성합니다. TSI 또는 RSI를 사용하는 것보다 더 많은 가짜 신호를 필터링 할 수 있습니다. 또한, 이 전략은 기본 파라미터보다 더 급진적인 TSI와 RSI 파라미터 설정을 사용하여 더 일찍 고품질의 거래 신호를 얻을 수 있습니다.
위험 분석
이 전략에는 다음과 같은 위험들이 있습니다.
매개 변수 최적화 위험. 다른 시장, 다른 품종, 다른 주기에서, TSI와 RSI의 최적의 매개 변수는 다를 수 있으며, 특정 상황에 맞게 최적화가 필요합니다.
트렌드 역전 위험. 전략 자체는 트렌드에 초점을 맞추고, 갑작스러운 사건이 발생하면 단기 조정 또는 중기기 트렌드 역전으로 인해 전략은 큰 손실을 입을 것입니다.
신호 빈도 위험. 이 전략은 기본 변수보다 더 급진적인 변수 설정을 사용하며, 더 자주 거래 신호를 생성할 수 있으며, 더 높은 거래 비용과 구현의 어려움을 초래한다.
최적화 방향
이 전략은 다음과 같은 부분에서 최적화될 수 있습니다.
이동평균 등과 결합된 지표는 자주 거래되는 문제를 줄이기 위해 신호를 더욱 필터링합니다.
다양한 시장과 품종에 따라 TSI와 RSI 파라미터의 최적의 조합을 테스트하여 최적의 파라미터 설정을 찾습니다.
단편적 손실 위험을 통제하기 위해 손실을 막는 전략을 추가하십시오.
포지션 관리를 최적화하고, 트렌드가 강할 때 포지션을 늘리고, 트렌드가 약할 때 포지션을 줄인다.
요약하다
TRMMA 전략은 TSI와 RSI 지표가 결합되어 구매 및 판매 시기를 판단하여 트렌드를 포착 할 수있는 강력한 능력을 가지고 있습니다. TSI 또는 RSI를 단독으로 사용하는 것과 비교하여 가짜 신호를 효과적으로 필터링 할 수 있습니다. 변수 최적화, 손실 방지 전략, 위치 관리 등의 방법으로 전략의 안정성을 더욱 강화 할 수 있습니다. 이 전략은 일정 양의 기반을 가지고 높은 수익을 추구하는 투자자에게 적합합니다.
/*backtest
start: 2023-12-01 00:00:00
end: 2023-12-31 23:59:59
period: 1h
basePeriod: 15m
exchanges: [{"eid":"Futures_Binance","currency":"BTC_USDT"}]
*/

// "True relative Movement" or "TRM" for short is a system that combines my two favorite indicators: RSI and TSI. I strived to put together an indicator that combined the best of both
// in order to help discretionary traders predict market direction, weakness and strength. As with most technical indicators there are "Buy and sell" signals. Similiar to Elder Impulse system,
///TRM paints bars 3 different colors to display 3 different conditions: Blue for "Buy", Pink for "Sell", and gray for "Take profit/Hold". When the bars turn blue, that means all conditions
/// have been met. When they turn pink, no conditions have been met. When they are gray, only one condition has been met. The system is simple, yet effective. A buy signal is prodcued when
/// TSI is above the signal line, and RSI is above 50, and vice versa for sell signals. I have modified the default parameters for TSI and RSI for more "aggressive" entries and exits. I may later on
/// name this condition "Fast-TRM" and "Slow-TRM" for when default settings for TSI and RSI are applies, as this is a very robust system as well.

///******ES 1HR, 15MIN/5MIN SYSTEM***** Go long, when all time frame on a buy signal and vice versa. Take profit when the 5 min chart flips to buy or sell depending on what side of the trade you are on. Close or flip
//// long/short when time all time frames flip to Buy/Hold if short and Sell/Hold if long. Use 20EMA for additional confirmation.

//@version=4
strategy("TKP-TRM Strategy", overlay=true)
Note = input( 0, title = "TSI standard values are 25, 13, 13, and RSI is 14. Can change the default values to these for 'Slow TRM'")
long = input(title="TSI-Long Length", type=input.integer, defval=25)
short = input(title="TSI-Short Length", type=input.integer, defval=5)
signal = input(title="TSI-Signal Length", type=input.integer, defval=14)
price = close
double_smooth(src, long, short) =>
    fist_smooth = ema(src, long)
    ema(fist_smooth, short)
pc = change(price)
double_smoothed_pc = double_smooth(pc, long, short)
double_smoothed_abs_pc = double_smooth(abs(pc), long, short)
tsi_value = 100 * (double_smoothed_pc / double_smoothed_abs_pc)
TSI_Signal_Line = (ema(tsi_value, signal))


/////////////////////////////RSI////////////////////////////////////////////////

src = close, len = input(5, minval=1, title="RSILength")
up = rma(max(change(src), 0), len)
down = rma(-min(change(src), 0), len)
rsi = down == 0 ? 100 : up == 0 ? 0 : 100 - (100 / (1 + up / down))
rsiBuyfilterlevel = input(50, minval = 1, title = "RSI cross above Buy Level")
rsiSellfilterlevel = input(50, minval = 1, title = "RSI cross below Sell Level")

////////////////////////////Bar Coloring//////////////////////////////////////////////////////////

TRM_Buy = ((tsi_value > TSI_Signal_Line) and (rsi > rsiBuyfilterlevel))
TRM_Sell = ( (tsi_value < TSI_Signal_Line) and (rsi <rsiSellfilterlevel))
TRM_Color = TRM_Buy? #3BB3E4 : TRM_Sell? #FF006E : #b2b5be
barcolor(TRM_Color)


///////////////////////////Strategy Paramters////////////////////////////////////////

if (TRM_Buy)
    strategy.entry("Long", strategy.long, comment="Long")

if (TRM_Sell)
    strategy.close("Long", comment="Sell")