EMA TREND CLOUD
Penulis:ChaoZhang, Tarikh: 2022-05-18 15:32:51Tag:EMA
Ini bukan nasihat perdagangan - tiada jaminan - gunakan atas risiko anda sendiri
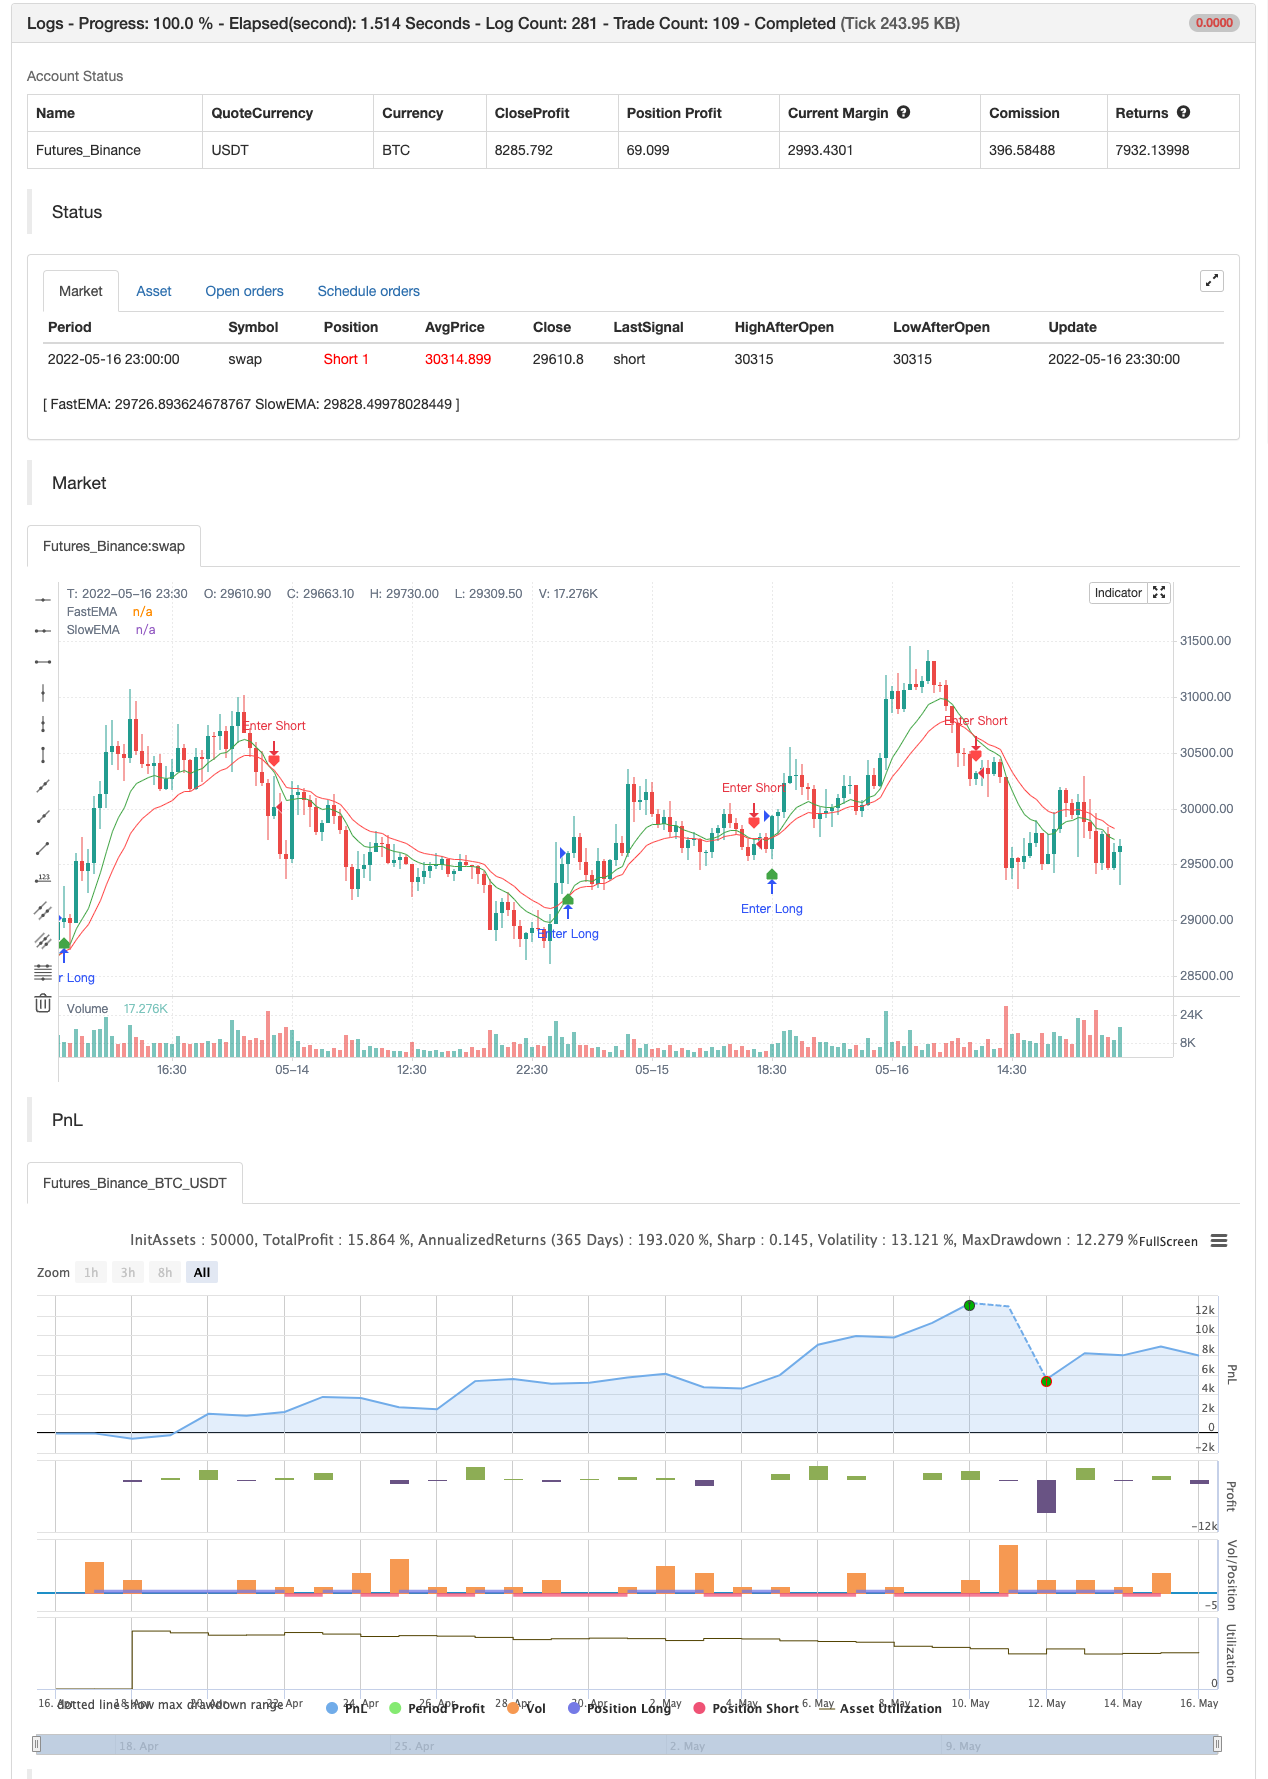
Menggambar purata bergerak eksponen 9 dan 20 tempoh (EMA) dan melukis awan di antara, secara visual mengenal pasti trend intraday dan kekuatannya. Awan hijau untuk panjang, awan merah untuk pendek. semakin tebal awan semakin kuat trend. entri bermain panjang adalah apabila 9 EMA melintasi di atas 20 EMA menyebabkan awan menjadi hijau, bertentangan untuk pendek.
Masuk agresif adalah di penutupan bar yang menyebabkan persilangan berlaku. Masuk konservatif adalah apabila bar kedua selepas persilangan ditutup di atas 9 EMA dan berada di arah permainan.
Keluar boleh berlaku apabila harga ditutup di awan atau di sisi yang bertentangan dengan awan atau apabila purata menyeberang ke arah yang bertentangan dengan perdagangan bergantung kepada toleransi risiko individu.
Ini bukan nasihat perdagangan - tiada jaminan - gunakan atas risiko anda sendiri
Ujian belakang
/*backtest
start: 2022-04-17 00:00:00
end: 2022-05-16 23:59:00
period: 30m
basePeriod: 15m
exchanges: [{"eid":"Futures_Binance","currency":"BTC_USDT"}]
args: [["v_input_1",10],["v_input_2",18]]
*/

// This source code is subject to the terms of the Mozilla Public License 2.0 at https://mozilla.org/MPL/2.0/
// © Ron Westbrook (discord: disturbinglymellow#4075)
// Date: 5/17/2021
// Description: Plots two exponential moving averages and places a colored cloud between to indicate trend direction. Default values of 9 and 20 periods have worked well for me, but inputs are available if you choose to change them. If you like my work and want to support more of it please consider leaving me a tip here. https://tinyurl.com/tipron


//@version=5
indicator(title='EMA TREND CLOUD', overlay=true)

fastLen = input(title='Fast EMA Length', defval=9)
slowLen = input(title='Slow EMA Length', defval=20)
useTextLabels = input.bool(true, title='Use Text-Based Crossover Labels?', group='Crossover Moving Averages')

fastEMA = ta.ema(close, fastLen)
slowEMA = ta.ema(close, slowLen)

fema = plot(fastEMA, title='FastEMA', color=color.new(color.green, 0), linewidth=1, style=plot.style_line)
sema = plot(slowEMA, title='SlowEMA', color=color.new(color.red, 0), linewidth=1, style=plot.style_line)

fill(fema, sema, color=fastEMA > slowEMA ? color.new(#417505, 50) : color.new(#890101, 50), title='Cloud')

// Bull and Bear Alerts
Bull = ta.crossover(fastEMA, slowEMA)
Bear = ta.crossunder(fastEMA, slowEMA)

plotshape(Bull, title='Calls Label', color=color.new(color.green, 25), textcolor=useTextLabels ? color.white : color.new(color.white, 100), style=useTextLabels ? shape.labelup : shape.triangleup, text='Calls', location=location.belowbar)

plotshape(Bear, title='Puts Label', color=color.new(color.red, 25), textcolor=useTextLabels ? color.white : color.new(color.white, 100), style=useTextLabels ? shape.labeldown : shape.triangledown, text='Puts', location=location.abovebar)


if Bull
    alert('Calls Alert: 9ema crossed over 20ema', alert.freq_once_per_bar_close)
if Bear
    alert('Puts Alert: 9ema crossed under 20ema', alert.freq_once_per_bar_close)


if Bull
    strategy.entry("Enter Long", strategy.long)
else if Bear
    strategy.entry("Enter Short", strategy.short)
- RSI dan Dual EMA Crossover Signal Strategi Kuantitatif
- Teori Gelombang Elliott 4-9 Impulse Wave Automatic Detection Strategi Dagangan
- KRK aDa Strategi Pembalikan Rata-rata Slow Stochastic dengan Peningkatan AI
- EMA23/EMA50 Strategi Dagangan Kuantitatif Crossover Purata Bergerak Berganda
- MACD Golden Cross dan Death Cross Strategi
- MACD-V dan Fibonacci Multi-Timeframe Dynamic Take Profit Strategi
- Strategi Dagangan Kuantitatif Berdasarkan Purata Bergerak dan Bollinger Bands
- MACD BB Strategy Penembusan
- Wavetrend Amplitude Besar Terlalu Dijual Rebound Grid Strategi Perdagangan
- Strategi Perpindahan MACD
- ZeroLag MACD Strategi Pendek Panjang
- ATR dihaluskan
- Pencari Blok Perintah
- TrendScalp-FractalBox-3EMA
- Isyarat QQE
- U-bit grid amplitude penyaringan
- CM MACD Indikator Sesuai - Kerangka Masa Berbilang - V2
- HODL LINE
- 2 Pengesanan Arah Rata-rata Bergerak Warna
- Scalping PullBack Tool R1
- Strategi Beli&Jual bergantung kepada AO+Stoch+RSI+ATR
- Rasio Tenaga Arah RedK Volume-Pengcepat
- Donchian Breakout tiada cat semula
- Bar Momentum RedK
- SuperJump Turn Back Bollinger Band
- Trend Fukuiz
- BOT Johny
- SSL Hibrid
- Keluar Chandelier
- Risotto
- EMA Cloud Intraday Strategi
bwxiaokSaya tidak faham bahasa Inggeris.