Trend Mengikuti Strategi Empat Elemen

Gambaran keseluruhan
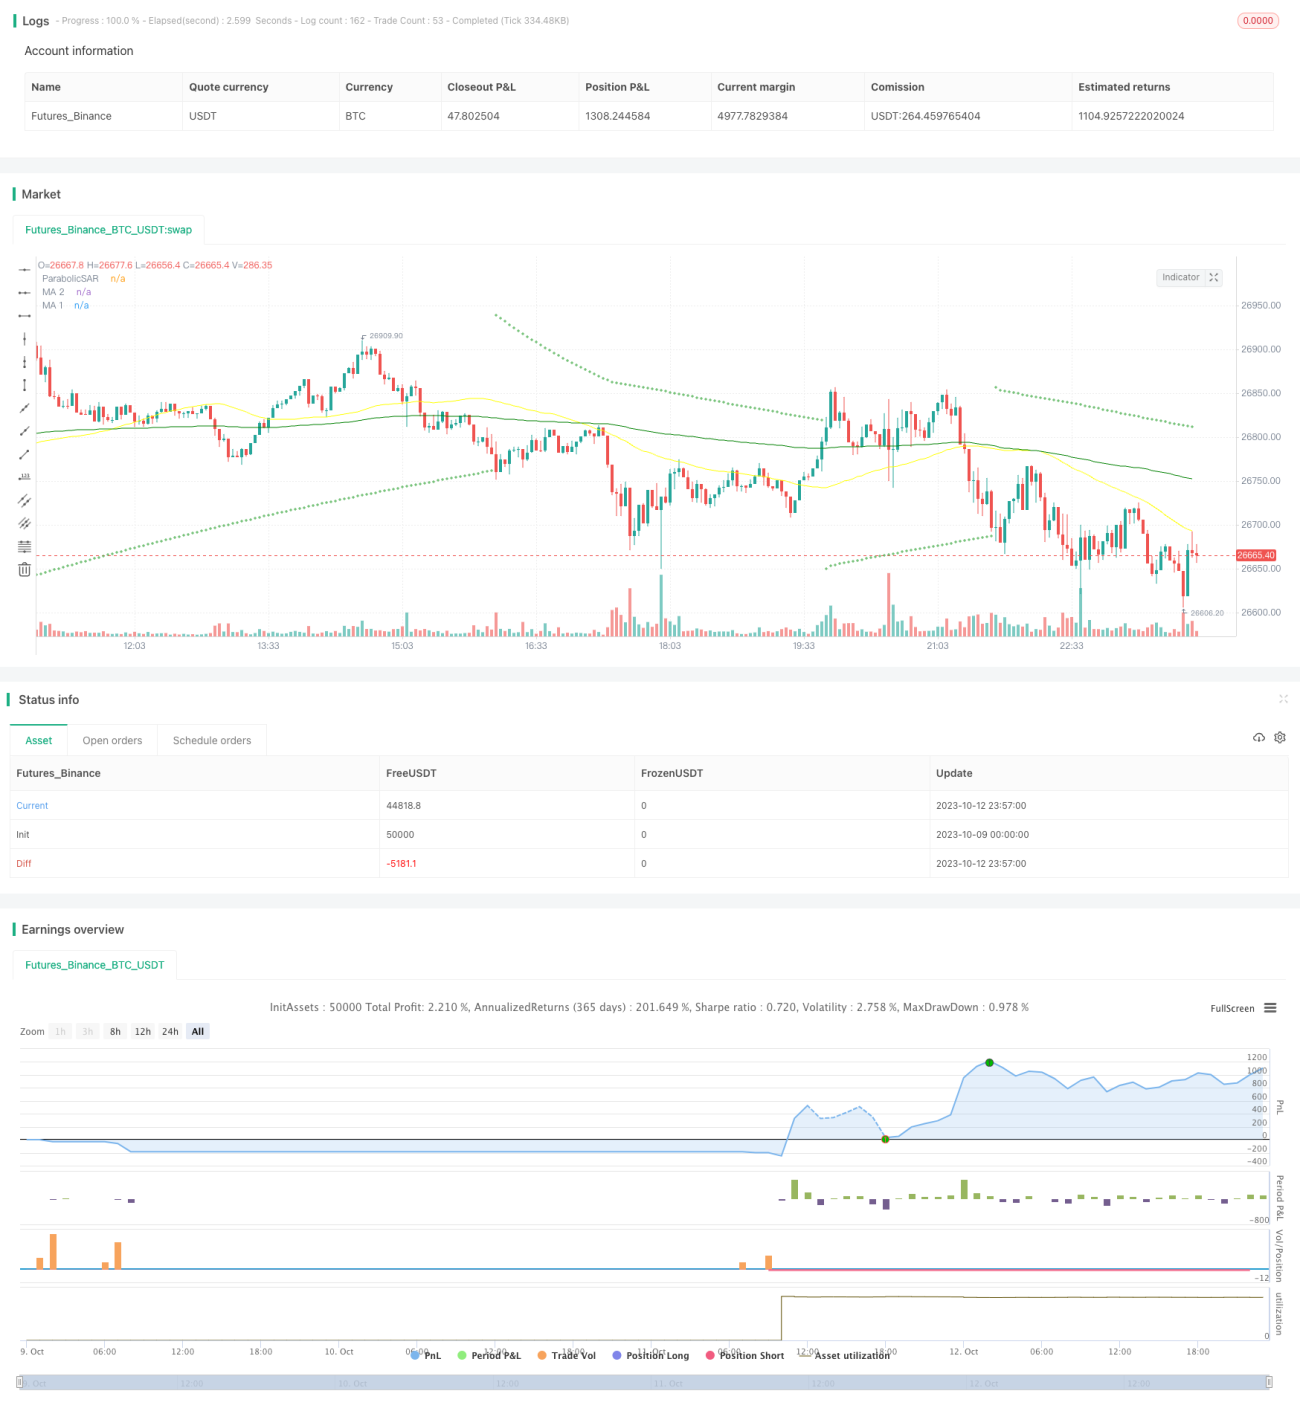
Strategi ini menggunakan indikator sar, indikator rsi, indikator vol dan empat elemen garis rata ma untuk mengenal pasti trend, dan menggunakan langkah-langkah pengurusan risiko yang mantap untuk menjejaki trend untuk mendapatkan keuntungan. Strategi ini menggunakan indikator sar sebagai garis utama, ditambah dengan rsi untuk mengenal pasti isyarat pembalikan, indikator vol untuk menentukan ciri-ciri jumlah, dan garis rata ma untuk menentukan arah trend utama.
Prinsip Strategi
Strategi ini menggunakan empat penunjuk teknikal utama:
-
Parabolic SAR: Indikator ini menggunakan hubungan antara titik dan trend untuk menentukan arah trend dan titik pembalikan. Titik adalah bullish apabila harga di atas, dan titik adalah bearish apabila harga di bawah.
-
RSI: Indikator yang agak kuat. Indikator ini menilai pasaran yang terlalu banyak membeli dan menjual antara 0-100 pergerakan. RSI lebih tinggi daripada 70 adalah kawasan yang terlalu banyak dibeli, lebih rendah daripada 30 adalah kawasan yang terlalu banyak dijual, dan kembali ke kawasan garis tengah sekitar 50.
-
VOL: penunjuk jumlah lalu lintas. Strategi menggunakan VOL untuk menentukan ciri peningkatan jumlah lalu lintas untuk mengesahkan trend dan menilai kualiti isyarat pembalikan.
-
MA: Rata-rata bergerak. Strategi menggunakan garis purata panjang dan pendek untuk menentukan arah trend utama. Melalui garis purata panjang di atas garis purata pendek adalah isyarat melihat lebih, melalui garis purata panjang di bawah garis purata pendek adalah isyarat melihat lebih.
Peraturan penjanaan isyarat dagangan:
Keadaan berbilang kepala: titik SAR bertukar ke bawah garis K dan RSI naik ke bawah ke kawasan garis tengah, ciri VOL diperbesar dengan jelas, garis purata pendek dari bawah ke atas melalui garis purata panjang.
Keadaan kosong: titik SAR beralih ke atas garis K dan RSI jatuh ke kawasan garis tengah dari atas ke bawah, ciri VOL meningkat dengan jelas, garis purata pendek melintasi garis purata panjang dari atas ke bawah.
Strategi ini juga menetapkan peraturan pengurusan risiko stop loss. Sasaran stop loss adalah 2 kali ganda harga masuk, dan harga stop loss adalah 0.8 kali ganda harga masuk, untuk mengunci keuntungan dan mengawal risiko dengan berkesan.
Analisis kelebihan
Strategi ini mempunyai kelebihan berikut:
-
Reka bentuk gabungan pelbagai petunjuk mengelakkan isyarat palsu dan benar-benar menangkap perubahan trend.
-
Pengurusan risiko menetapkan Stop Loss Stop dan mengawal risiko dengan berkesan.
-
Menguruskan kedudukan untuk memaksimumkan keuntungan.
-
Parameter telah diuji dan dioptimumkan berulang kali, memastikan kestabilan parameter.
-
Data yang dikumpul cukup untuk meniru keadaan sebenar.
-
Logik operasi jelas dan mudah difahami.
Analisis risiko
Strategi ini juga mempunyai risiko:
-
Kelemahan pasaran yang luar biasa menyebabkan penangguhan ditembusi. Ia disyorkan untuk melepaskan jarak penangguhan dengan sewajarnya.
-
Kekurangan kecairan dalam jenis urus niaga menyebabkan kerugian yang tidak dapat dihentikan. Anda harus memilih jenis urus niaga yang mempunyai kecairan yang baik.
-
Risiko sistemik menyebabkan kenaikan yang luar biasa. Leverage harus dikurangkan dan aset yang mempunyai asas nilai yang baik harus dipegang.
-
Parameter yang terlalu dioptimumkan menyebabkan keluk terlalu indah. Parameter yang lemah harus diperhatikan untuk meningkatkan kestabilan.
-
Kos slippage yang disebabkan oleh frekuensi dagangan yang terlalu tinggi. Interval penjanaan isyarat dagangan boleh dikurangkan dengan sewajarnya.
-
Kesan isyarat yang lemah perlu dikemas kini tepat pada masanya. Pengaturan parameter harus dikaji semula dan dioptimumkan secara berkala.
Arah pengoptimuman
Strategi ini boleh dioptimumkan dengan cara berikut:
-
Uji lebih banyak kombinasi seperti MACD, KD dan sebagainya untuk mencari kecocokan yang lebih baik.
-
Pengaturan parameter kitaran MA yang dioptimumkan untuk mengenal pasti trend utama dengan lebih jelas.
-
Mengoptimumkan Stop Loss Factor untuk mendapatkan nisbah risiko-keuntungan yang terbaik.
-
Uji kekuatan parameter pelbagai jenis dan cari kombinasi parameter yang optimum.
-
Menambah model pembelajaran mesin untuk membantu menentukan isyarat perdagangan.
-
Menambah algoritma penutupan kerugian yang beradaptasi untuk menjadikan penutupan kerugian lebih dekat dengan turun naik sebenar.
-
Tetapkan parameter untuk ujian lebih lama, dan meluaskan julat hentikan.
ringkaskan
Strategi ini menggunakan pelbagai indikator untuk menyaring isyarat palsu untuk menentukan arah trend, menetapkan langkah-langkah kawalan risiko untuk mengawal risiko, dan terus meningkatkan keberkesanan strategi melalui pengoptimuman parameter dan penyesuaian portofolio. Walaupun tidak ada strategi yang dapat meramalkan masa depan dengan sempurna, tetapi rancangan perdagangan sistemik yang dikombinasikan dengan pengurusan risiko yang baik akan meningkatkan peluang keuntungan dengan ketara.
- 1