EMA TREND CLOUD
Autora:ChaoZhang, Data: 2022-05-18 15:32:51Tags:EMA
Este não é um conselho comercial - NÃO HÁ GARANTÍAS - USE A SEU PRÓPRIO RISCO
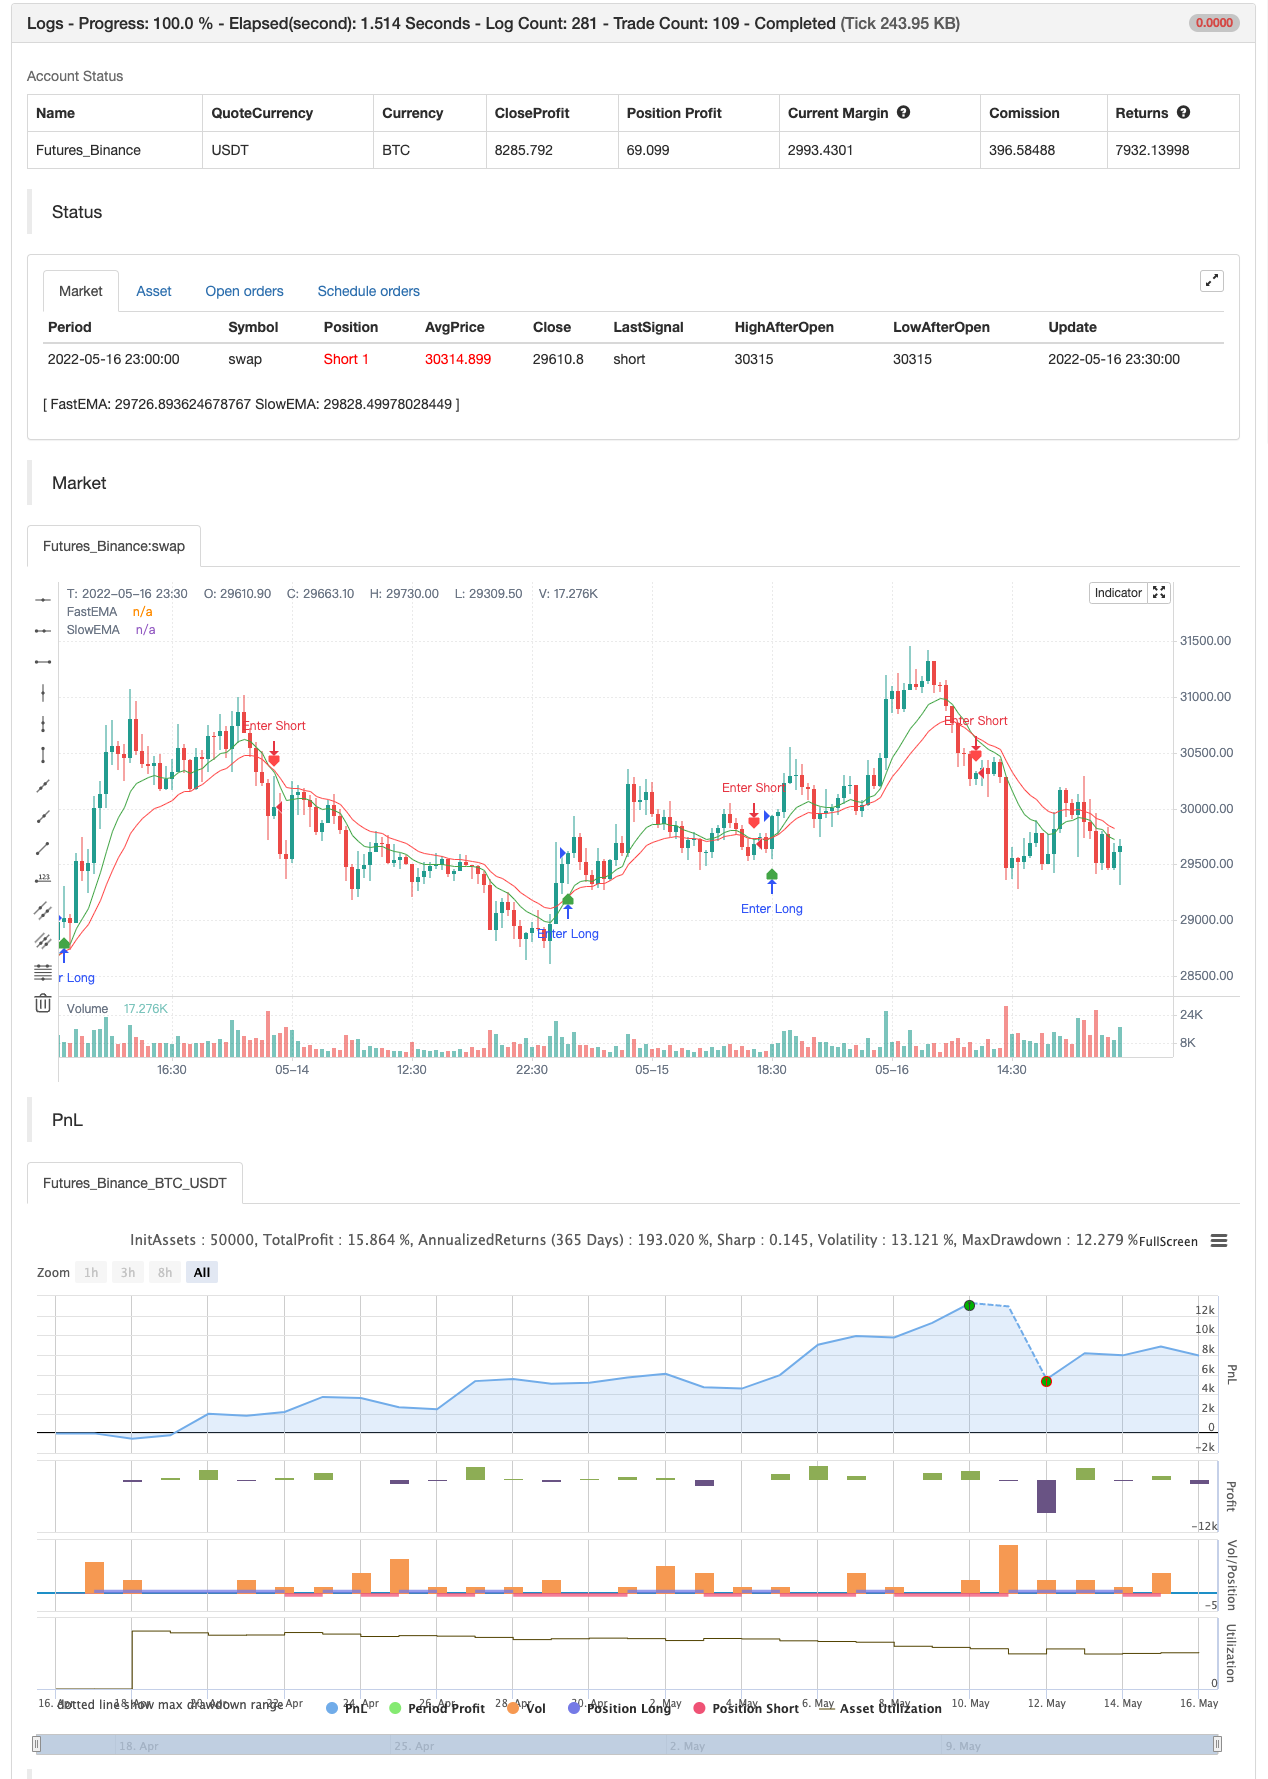
O gráfico traça as médias móveis exponenciais de 9 e 20 períodos (EMA) e pinta uma nuvem entre elas, identificando visualmente a tendência intradiária e a força dela. Nuvem verde para longa, nuvem vermelha para curta. Quanto mais espessa a nuvem, mais forte a tendência. A entrada de longa duração é quando a 9 EMA cruza acima da 20 EMA, fazendo com que a nuvem se torne verde, oposta para curta.
A entrada agressiva é no final da barra que faz com que o cruzamento aconteça. A entrada conservadora é quando a segunda barra após o cruzamento fecha acima da 9 EMA e está na direção da jogada.
As saídas podem ocorrer quando o preço fecha na nuvem ou no lado oposto da nuvem ou quando as médias cruzam na direção oposta do comércio, dependendo da tolerância ao risco do indivíduo.
Este não é um conselho comercial - NÃO HÁ GARANTÍAS - USE A SEU PRÓPRIO RISCO
backtest
/*backtest
start: 2022-04-17 00:00:00
end: 2022-05-16 23:59:00
period: 30m
basePeriod: 15m
exchanges: [{"eid":"Futures_Binance","currency":"BTC_USDT"}]
args: [["v_input_1",10],["v_input_2",18]]
*/

// This source code is subject to the terms of the Mozilla Public License 2.0 at https://mozilla.org/MPL/2.0/
// © Ron Westbrook (discord: disturbinglymellow#4075)
// Date: 5/17/2021
// Description: Plots two exponential moving averages and places a colored cloud between to indicate trend direction. Default values of 9 and 20 periods have worked well for me, but inputs are available if you choose to change them. If you like my work and want to support more of it please consider leaving me a tip here. https://tinyurl.com/tipron


//@version=5
indicator(title='EMA TREND CLOUD', overlay=true)

fastLen = input(title='Fast EMA Length', defval=9)
slowLen = input(title='Slow EMA Length', defval=20)
useTextLabels = input.bool(true, title='Use Text-Based Crossover Labels?', group='Crossover Moving Averages')

fastEMA = ta.ema(close, fastLen)
slowEMA = ta.ema(close, slowLen)

fema = plot(fastEMA, title='FastEMA', color=color.new(color.green, 0), linewidth=1, style=plot.style_line)
sema = plot(slowEMA, title='SlowEMA', color=color.new(color.red, 0), linewidth=1, style=plot.style_line)

fill(fema, sema, color=fastEMA > slowEMA ? color.new(#417505, 50) : color.new(#890101, 50), title='Cloud')

// Bull and Bear Alerts
Bull = ta.crossover(fastEMA, slowEMA)
Bear = ta.crossunder(fastEMA, slowEMA)

plotshape(Bull, title='Calls Label', color=color.new(color.green, 25), textcolor=useTextLabels ? color.white : color.new(color.white, 100), style=useTextLabels ? shape.labelup : shape.triangleup, text='Calls', location=location.belowbar)

plotshape(Bear, title='Puts Label', color=color.new(color.red, 25), textcolor=useTextLabels ? color.white : color.new(color.white, 100), style=useTextLabels ? shape.labeldown : shape.triangledown, text='Puts', location=location.abovebar)


if Bull
    alert('Calls Alert: 9ema crossed over 20ema', alert.freq_once_per_bar_close)
if Bear
    alert('Puts Alert: 9ema crossed under 20ema', alert.freq_once_per_bar_close)


if Bull
    strategy.entry("Enter Long", strategy.long)
else if Bear
    strategy.entry("Enter Short", strategy.short)
- RSI e Estratégia Quantitativa de Crossover de Sinais Dual EMA
- Teoria da onda de Elliott 4-9 Detecção automática de onda de impulso Estratégia de negociação
- KRK aDa Estratégia de reversão média lenta estocástica com melhorias da IA
- EMA23/EMA50 Estratégia de negociação quantitativa cruzada de média móvel dupla
- Estratégia MACD Golden Cross e Death Cross
- MACD-V e Fibonacci Multi-Timeframe Dynamic Take Profit Strategy
- Estratégia quantitativa de negociação baseada em médias móveis e bandas de Bollinger
- Estratégia de ruptura do MACD BB
- Estratégia de negociação da rede de rebote de grande amplitude Wavetrend
- Estratégia de cruzamento do MACD
- ZeroLag MACD Estratégia curta longa
- ATR suavizado
- Buscador de blocos de ordem
- TendênciaScalp-FractalBox-3EMA
- Sinais QQE
- Filtragem de amplitude de grelha de bits U
- Indicador MACD personalizado CM - Quadro de tempo múltiplo - V2
- LÍNIA HODL
- 2 Detecção da direção da média móvel de cores
- Instrumento de recuperação de scalping R1
- A estratégia de compra e venda depende de AO+Stoch+RSI+ATR
- RedK Relação volume-aceleração da energia direcional
- Donchian Breakout sem pintura
- Barras de Momento RedK
- SuperJump Volta para trás Banda de Bollinger
- Tendência Fukuiz
- O BOT do Johnny.
- SSL híbrido
- Saída do candelabro
- RISOTTO
- Estratégia intradiária de nuvem da EMA
BvxiaokNão entendo inglês.