Maximizador de lucro PMax
Autora:ChaoZhang, Data: 2022-05-25 17:13:45Tags:SMAEMAWMATMAATRZLEMA
Tanto os indicadores MOST como os SuperTrend são muito bons em sistemas de tendência, mas, por outro lado, seu desempenho não é brilhante em condições de mercado lateral como a maioria dos outros indicadores.
O PMax combina os lados poderosos do MOST (Moving Average Trend Changer) e do SuperTrend (ATR price detection) em um único indicador.
Os resultados de backtest e otimização do PMax são muito melhores quando comparados com seus antepassados MOST e SuperTrend.
O PMax é fácil de determinar a tendência e pode ser utilizado em qualquer tipo de mercado e instrumento.
O primeiro parâmetro do indicador PMax definido pelos três parâmetros é o período/duração do ATR.
O segundo parâmetro é o multiplicador de ATR que seria útil para definir o valor da distância da média móvel incorporada.
Pessoalmente, acho que o parâmetro mais importante é o comprimento e o tipo da média móvel.
O PMax será muito sensível aos movimentos da tendência se o comprimento da média móvel for menor e, vice-versa, será menos sensível quando for mais longo.
À medida que o período aumenta, torna-se menos sensível a pequenas tendências e ações de preços.
Desta forma, a sua escolha de período estará estreitamente relacionada com o tipo de tendências que lhe interessam.
Estamos sob o efeito da tendência ascendente nos casos em que a média móvel está acima do PMax; Por outro lado, sob a influência de uma tendência descendente, quando a média móvel está abaixo do PMax.
Construído no tipo de média móvel definido por padrão como EMA, mas os usuários podem escolher entre 8 tipos diferentes de média móvel como:
SMA: média móvel simples EMA: média móvel exponencial WMA: média móvel ponderada TMA: média móvel triangular VAR: índice variável média móvel dinâmica também conhecida como VIDYA WWMA: Welles Wilder's Moving Average ZLEMA: média móvel exponencial de atraso zero TSF: A verdadeira força da força
Dica: em lateral o VAR seria uma boa escolha
Você pode usar alarmes padrão PMax e Buy Sell sinais como:
1- Comprar quando a média móvel cruzar acima do PMax VENDER quando a média móvel cruzar abaixo do PMax
2- Comprar quando os preços saltarem sobre a linha Pmax. Vender quando os preços descerem abaixo da linha Pmax.
backtest
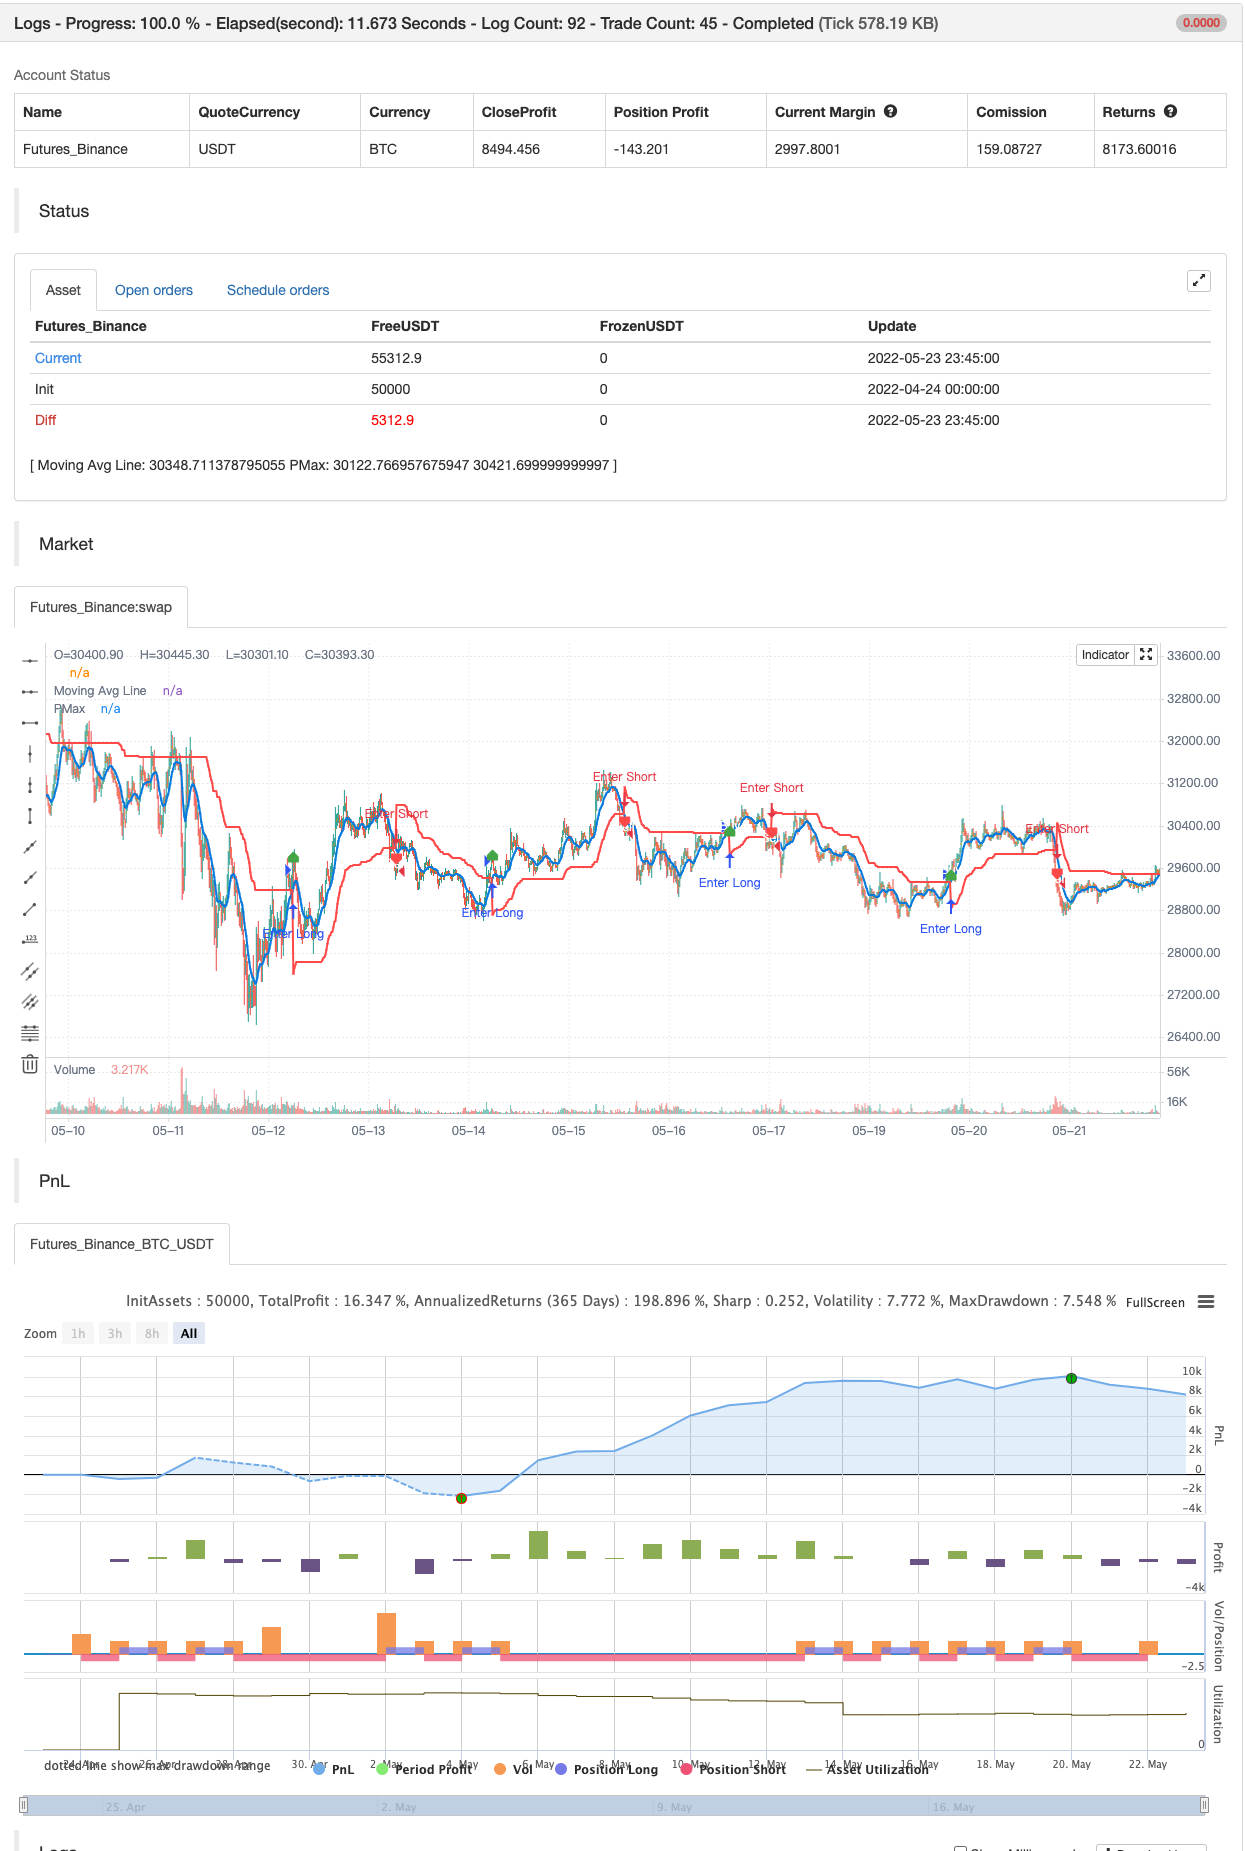
/*backtest
start: 2022-04-24 00:00:00
end: 2022-05-23 23:59:00
period: 15m
basePeriod: 5m
exchanges: [{"eid":"Futures_Binance","currency":"BTC_USDT"}]
*/

//@version=4
// This source code is subject to the terms of the Mozilla Public License 2.0 at https://mozilla.org/MPL/2.0/
// © KivancOzbilgic
//developer: @KivancOzbilgic
//author: @KivancOzbilgic

study("Profit Maximizer","PMax", overlay=true, format=format.price, precision=2, resolution="")
src = input(hl2, title="Source")
Periods = input(title="ATR Length", type=input.integer, defval=10)
Multiplier = input(title="ATR Multiplier", type=input.float, step=0.1, defval=3.0)
mav = input(title="Moving Average Type", defval="EMA", options=["SMA", "EMA", "WMA", "TMA", "VAR", "WWMA", "ZLEMA", "TSF"])
length =input(10, "Moving Average Length", minval=1)
changeATR= input(title="Change ATR Calculation Method ?", type=input.bool, defval=true)
Normalize= input(title="Normalize ATR ?", type=input.bool, defval=false)
showsupport = input(title="Show Moving Average?", type=input.bool, defval=true)
showsignalsk = input(title="Show Crossing Signals?", type=input.bool, defval=true)
showsignalsc = input(title="Show Price/Pmax Crossing Signals?", type=input.bool, defval=false)
highlighting = input(title="Highlighter On/Off ?", type=input.bool, defval=true)
atr2 = sma(tr, Periods)
atr= changeATR ? atr(Periods) : atr2
valpha=2/(length+1)
vud1=src>src[1] ? src-src[1] : 0
vdd1=src<src[1] ? src[1]-src : 0
vUD=sum(vud1,9)
vDD=sum(vdd1,9)
vCMO=nz((vUD-vDD)/(vUD+vDD))
VAR=0.0
VAR:=nz(valpha*abs(vCMO)*src)+(1-valpha*abs(vCMO))*nz(VAR[1])
wwalpha = 1/ length
WWMA = 0.0
WWMA := wwalpha*src + (1-wwalpha)*nz(WWMA[1])
zxLag = length/2==round(length/2) ? length/2 : (length - 1) / 2
zxEMAData = (src + (src - src[zxLag]))
ZLEMA = ema(zxEMAData, length)
lrc = linreg(src, length, 0)
lrc1 = linreg(src,length,1)
lrs = (lrc-lrc1)
TSF = linreg(src, length, 0)+lrs
getMA(src, length) =>
    ma = 0.0
    if mav == "SMA"
        ma := sma(src, length)
        ma

    if mav == "EMA"
        ma := ema(src, length)
        ma

    if mav == "WMA"
        ma := wma(src, length)
        ma

    if mav == "TMA"
        ma := sma(sma(src, ceil(length / 2)), floor(length / 2) + 1)
        ma

    if mav == "VAR"
        ma := VAR
        ma

    if mav == "WWMA"
        ma := WWMA
        ma

    if mav == "ZLEMA"
        ma := ZLEMA
        ma

    if mav == "TSF"
        ma := TSF
        ma
    ma

MAvg=getMA(src, length)
longStop = Normalize ? MAvg - Multiplier*atr/close : MAvg - Multiplier*atr
longStopPrev = nz(longStop[1], longStop)
longStop := MAvg > longStopPrev ? max(longStop, longStopPrev) : longStop
shortStop = Normalize ? MAvg + Multiplier*atr/close : MAvg + Multiplier*atr
shortStopPrev = nz(shortStop[1], shortStop)
shortStop := MAvg < shortStopPrev ? min(shortStop, shortStopPrev) : shortStop
dir = 1
dir := nz(dir[1], dir)
dir := dir == -1 and MAvg > shortStopPrev ? 1 : dir == 1 and MAvg < longStopPrev ? -1 : dir
PMax = dir==1 ? longStop: shortStop
plot(showsupport ? MAvg : na, color=#0585E1, linewidth=2, title="Moving Avg Line")
pALL=plot(PMax, color=color.red, linewidth=2, title="PMax", transp=0)
alertcondition(cross(MAvg, PMax), title="Cross Alert", message="PMax - Moving Avg Crossing!")
alertcondition(crossover(MAvg, PMax), title="Crossover Alarm", message="Moving Avg BUY SIGNAL!")
alertcondition(crossunder(MAvg, PMax), title="Crossunder Alarm", message="Moving Avg SELL SIGNAL!")
alertcondition(cross(src, PMax), title="Price Cross Alert", message="PMax - Price Crossing!")
alertcondition(crossover(src, PMax), title="Price Crossover Alarm", message="PRICE OVER PMax - BUY SIGNAL!")
alertcondition(crossunder(src, PMax), title="Price Crossunder Alarm", message="PRICE UNDER PMax - SELL SIGNAL!")

buySignalk = crossover(MAvg, PMax)
plotshape(buySignalk and showsignalsk ? PMax*0.995 : na, title="Buy", text="Buy", location=location.absolute, style=shape.labelup, size=size.tiny, color=color.green, textcolor=color.white, transp=0)

sellSignallk = crossunder(MAvg, PMax)
plotshape(sellSignallk and showsignalsk ? PMax*1.005 : na, title="Sell", text="Sell", location=location.absolute, style=shape.labeldown, size=size.tiny, color=color.red, textcolor=color.white, transp=0)

buySignalc = crossover(src, PMax)
plotshape(buySignalc and showsignalsc ? PMax*0.995 : na, title="Buy", text="Buy", location=location.absolute, style=shape.labelup, size=size.tiny, color=#0F18BF, textcolor=color.white, transp=0)

sellSignallc = crossunder(src, PMax)
plotshape(sellSignallc and showsignalsc ? PMax*1.005 : na, title="Sell", text="Sell", location=location.absolute, style=shape.labeldown, size=size.tiny, color=#0F18BF, textcolor=color.white, transp=0)

mPlot = plot(ohlc4, title="", style=plot.style_circles, linewidth=0,display=display.none)
longFillColor = highlighting ? (MAvg>PMax ? color.green : na) : na
shortFillColor = highlighting ? (MAvg<PMax ? color.red : na) : na

fill(mPlot, pALL, title="UpTrend Highligter", color=longFillColor)
fill(mPlot, pALL, title="DownTrend Highligter", color=shortFillColor)


if buySignalk
    strategy.entry("Enter Long", strategy.long)
else if sellSignallk
    strategy.entry("Enter Short", strategy.short)
- Média móvel supertrendada
- SuperJump Volta para trás Banda de Bollinger
- Super Scalper
- A ESSMA
- Super Scalper - 5 Min 15 Min
- Modelo de alertas ML
- Estratégia quantitativa de negociação baseada em médias móveis e bandas de Bollinger
- HALFTREND + HEMA + SMA (estratégia de sinal falso)
- RedK Dual VADER com barras de energia
- Alerta cruzada média móvel, multi-tempo (MTF)
- FTSMA - Trend é o teu amigo
- Filtro de faixa Comprar e vender
- Canal SSL
- Estratégia do Hull Suite
- Parabólica SAR Compra e Venda
- Maxima e Mínima baseadas em pivô
- Nick Rypock Trailing Reverse (NRTR)
- ZigZag PA Estratégia V4.1
- Comprar/Vender intradiário
- Fractal quebrado: o sonho quebrado de alguém é o seu lucro!
- Estratégia de vitória perfeita
- Estocástico + RSI, Estratégia Dupla
- Estratégia Swing Hull/rsi/EMA
- Instrumento de negociação Swing Scalping R1-4
- A melhor estratégia de engolf + escape
- Alerta Bollinger Awesome R1
- Plugins para a partilha de várias bolsas
- Triângulo de diferença (ou seja, a diferença de preço de mercado de pequenas moedas)
- Grades dinâmicas de contrato inverso bybit (grades específicas)
- Alertas de tradingView para MT4 MT5 + variáveis dinâmicas