
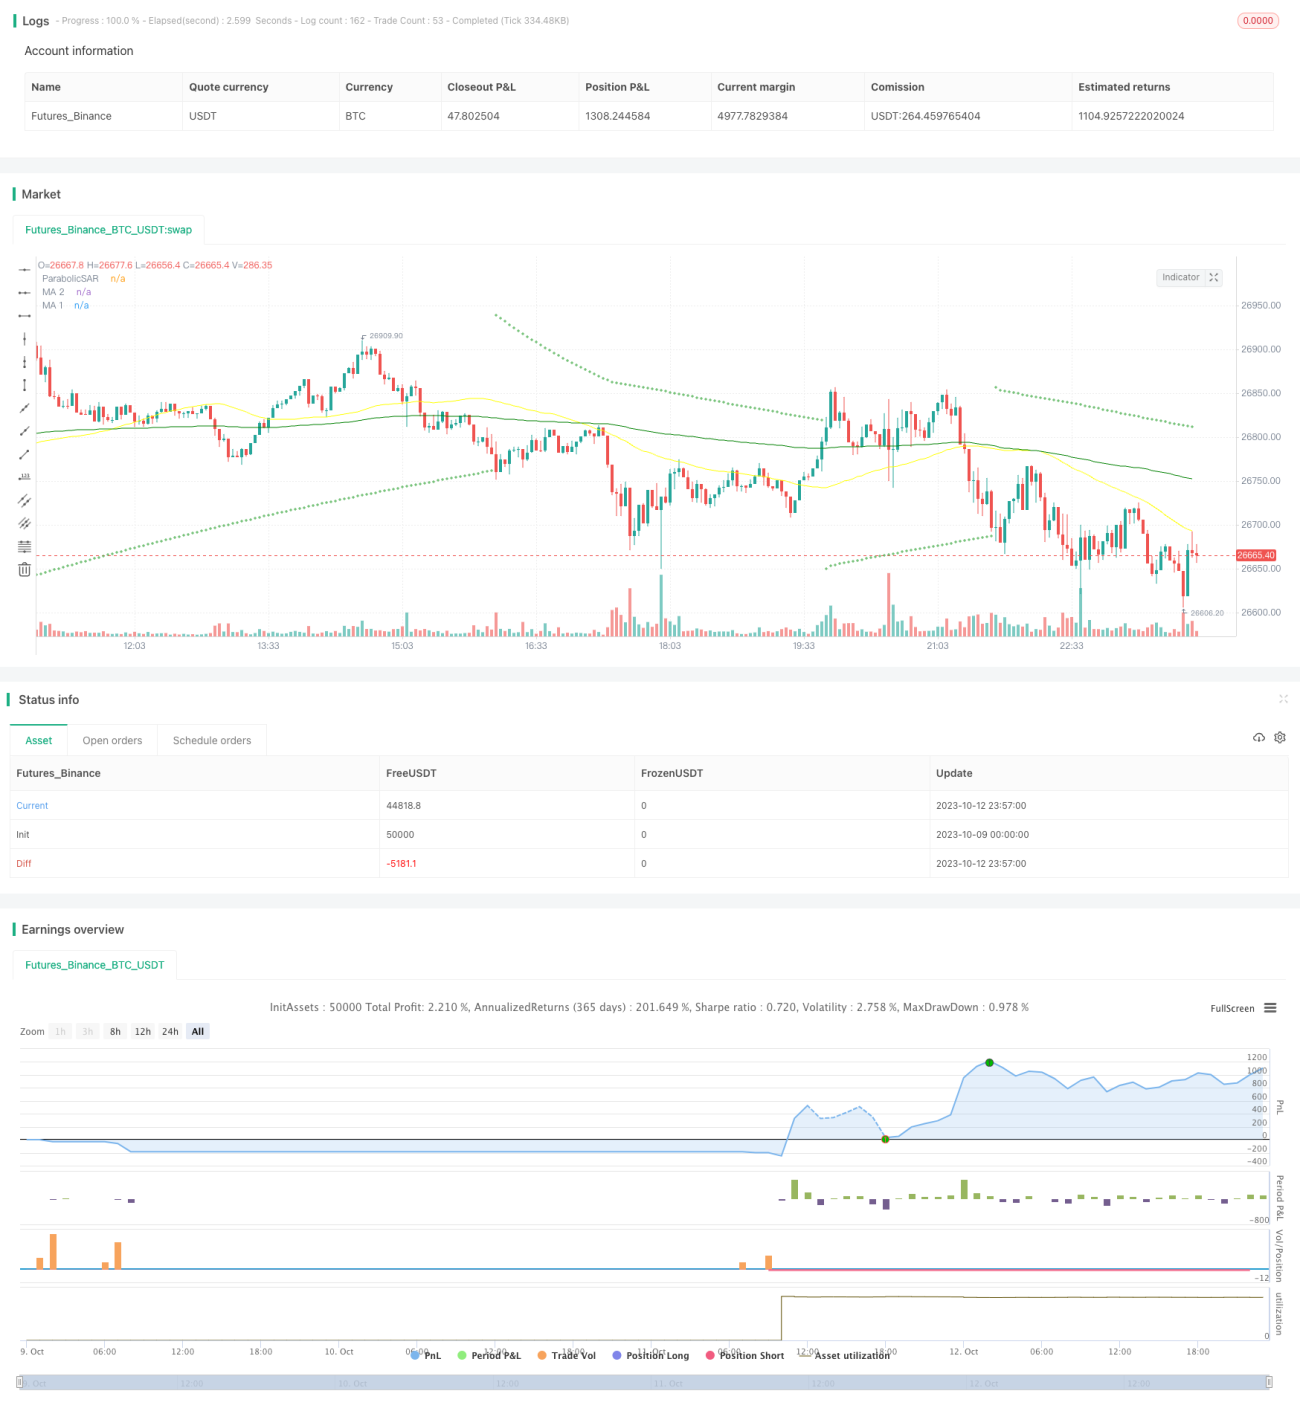
Esta estratégia utiliza o indicador sar, o indicador rsi, o indicador vol e os quatro elementos da linha média de ma para identificar a tendência e monitorar a tendência para obter lucro com medidas sólidas de gerenciamento de risco. A estratégia utiliza o indicador sar como linha principal, auxiliada pelo rsi para identificar os sinais de reversão da divisão de sobrecompra e venda, o indicador vol é determinado como uma característica de volume, e a linha média de ma determina a direção da tendência principal.
A estratégia utiliza quatro indicadores técnicos principais:
Parabolic SAR: O indicador usa a relação entre os pontos e a tendência para determinar a direção da tendência e os pontos de reversão. Os pontos são positivos quando o preço está acima e os pontos são negativos quando o preço está abaixo.
RSI: Indicador de Relativa Força e Fraqueza. O indicador julga os excessos de compra e venda entre 0 e 100. O RSI acima de 70 é a zona de compra e venda, abaixo de 30 é a zona de venda e volta para a zona de linha média.
VOL: Indicador de volume de transação. A estratégia usa o VOL para determinar a amplificação do volume de transação para confirmar a tendência e julgar a qualidade do sinal de reversão.
MA: Média móvel. A estratégia usa a média longa e curta para determinar a direção da tendência principal. A média longa e curta é um sinal de expectativa, e a média longa e curta é um sinal de expectativa.
Regras de geração de sinais de negociação:
Condição de múltipla cabeça: o SAR gira abaixo da linha K e o RSI sobe de baixo para cima para a região da linha média, o VOL amplifica a característica de forma evidente, a linha média curta atravessa a linha média longa de baixo para cima.
Condição de cabeça vazia: o SAR gira para cima da linha K e o RSI cai de cima para baixo para a região da linha média, o VOL amplifica a característica de forma evidente, a linha média curta atravessa a linha média longa de cima para baixo.
A estratégia também estabelece regras de gerenciamento de risco de stop-loss. O objetivo de stop-loss é de 2 vezes o preço de entrada e o preço de stop-loss é de 0,8 vezes o preço de entrada, efetivamente bloqueando os lucros e controlando o risco.
A estratégia tem as seguintes vantagens:
A combinação de múltiplos indicadores foi projetada para evitar falsos sinais e capturar verdadeiramente as reversões de tendência.
Gestão de Riscos: Configure o Stop Loss Stop para controlar os riscos.
A administração de posições é feita em lotes, para maximizar os lucros.
Os parâmetros foram testados e otimizados repetidamente, garantindo sua robustez.
Os dados de retorno são abundantes, simulando o ambiente de negociação real.
A lógica de operação é clara, simples e fácil de entender.
A estratégia também apresenta os seguintes riscos:
A volatilidade anormal do mercado levou à ruptura do stop loss. Recomenda-se uma flexibilidade apropriada do stop loss distance.
A falta de liquidez na variedade de negociação pode levar a perdas impossíveis de ser eliminadas.
O risco sistêmico leva a um salto anormal. Deve-se reduzir a alavancagem e manter ativos com uma boa base de valor.
A otimização excessiva dos parâmetros faz com que a curva seja muito boa. Os parâmetros devem ser adequadamente enfraquecidos para melhorar a estabilidade.
Os custos de deslizamento causados pela frequência excessiva de negociação. O intervalo de geração de sinais de negociação pode ser liberado adequadamente.
A diminuição do efeito do sinal precisa ser atualizada em tempo hábil. Deverá ser verificada periodicamente e otimizada a configuração dos parâmetros.
Esta estratégia pode ser melhorada nos seguintes aspectos:
Teste mais combinações de indicadores, como MACD, KD, etc., para encontrar uma melhor correspondência.
Otimizar a configuração dos parâmetros do ciclo MA para identificar mais claramente as tendências dominantes.
Otimizar o coeficiente de stop-loss para obter a melhor relação de risco-receita.
Teste a robustez dos parâmetros de diferentes variedades e procure a combinação de parâmetros ideal.
A adição de modelos de aprendizagem de máquina para auxiliar na determinação de sinais de negociação.
Adição de algoritmos de stop loss adaptativos, para que o stop loss fique mais próximo da real oscilação.
O teste tem um parâmetro de ciclo mais longo definido, ampliando o alcance da parada.
Esta estratégia utiliza vários indicadores para filtrar falsos sinais, determinar a direção da tendência, estabelecer medidas de controle de risco e controlar os riscos, e aumentar a eficácia da estratégia através da otimização de parâmetros e ajustes de portfólio. Embora nenhuma estratégia possa prever o futuro perfeitamente, o plano de negociação do sistema, juntamente com um bom gerenciamento de risco, aumentará significativamente a probabilidade de lucro.
/*backtest
start: 2023-10-09 00:00:00
end: 2023-10-13 00:00:00
period: 3m
basePeriod: 1m
exchanges: [{"eid":"Futures_Binance","currency":"BTC_USDT"}]
*/
// This source code is subject to the terms of the Mozilla Public License 2.0 at https://mozilla.org/MPL/2.0/
// © myn
//@version=5
strategy('Strategy Myth-Busting #6 - PSAR+MA+SQZMOM+HVI - [MYN]', max_bars_back=5000, overlay=true, pyramiding=0, initial_capital=20000, currency='USD', default_qty_type=strategy.percent_of_equity, default_qty_value=100.0, commission_value=0.075, use_bar_magnifier = false)
/////////////////////////////////////
//* Put your strategy logic below *//
/////////////////////////////////////
// dOg28adjYWY
//Trading Strategies Used
// Parabolic Sar
// 10 in 1 MA's
// Squeeze Momentum
// HawkEYE Volume Indicator
// Long Condition
// Parabolic Sar shift below price at last dot above and then previous bar needs to breach above that.
// Price action has to be below both MA's and 50MA needs to be above 200MA
// Squeeze Momentum needsd to be in green or close to going green
// HawkEYE Volume Indicator needs to be show a green bar on the histagram
// Short Condition
// Parabolic Sar shift above price at last dot below and then previous bar needs to breach below that.
// Price action needs to be above both MA's and 50MA needs to be below 200MA
// Squeeze Momentum needsd to be in red or close to going red
// HawkEYE Volume Indicator needs to be show a red bar on the histagram
// Parabolic SAR
//░░░░░░░░░░░░░░░░░░░░░░░░░░░░░░░░░░░░░░░░░░░░░░░░░░░░░░░░░░░░░░░░░░░░░░░░░░░░░░░░░░░░░░░░░░░░░░░░░░░░░░░░░░░░░░░░░░░░░░░░░░░░░░░░░░░░░░░░░░░░░░░░░░
//@version=5
//indicator(title="Parabolic SAR", shorttitle="SAR", overlay=true, timeframe="", timeframe_gaps=true)
// Dynamic Max based on trendcode
int TrendCodeAdaptive = switch timeframe.multiplier
1 => 1
3 => 1
5 => 1
10 => 2
15 => 3
30 => 5
45 => 5
60 => 7
120 => 9
180 => 9
240 => 13
300 => 14
360 => 15
=>
int(4)
bool overrideAdaptiveSar = input(false, title="Override Adaptive PSAR", group="Adaptive Parabolic Sar")
TrendCodeOverRide = input(5, title='Trend Code (If Overriding Adaptive PSAR)')
startPSAR = 0.02
increment = 0.02
maximum = overrideAdaptiveSar ? TrendCodeOverRide * 0.005 : TrendCodeAdaptive * 0.005
PSAR = ta.sar(startPSAR, increment, maximum)
plot(PSAR, "ParabolicSAR", style=plot.style_cross, color=color.green)
//PSARLongEntry = PSAR < close ? 1 : na
//PSARShortEntry = PSAR < close ? na : -1
PSARLongEntry = high < PSAR and barstate.isconfirmed
PSARShortEntry = low > PSAR and barstate.isconfirmed
// Squeeze Momentum
//░░░░░░░░░░░░░░░░░░░░░░░░░░░░░░░░░░░░░░░░░░░░░░░░░░░░░░░░░░░░░░░░░░░░░░░░░░░░░░░░░░░░░░░░░░░░░░░░░░░░░░░░░░░░░░░░░░░░░░░░░░░░░░░░░░░░░░░░░░░░░░░░░░
//@version=5
// @author LazyBear
// List of all my indicators: https://www.tradingview.com/v/4IneGo8h/
//
//indicator(shorttitle='SQZMOM_LB', title='Squeeze Momentum Indicator [LazyBear]', overlay=false)
lengthBB = input(20, title='BB Length', group="Squeeze Momentum")
mult = input(2.0, title='BB MultFactor')
lengthKC = input(20, title='KC Length')
multKC = input(1.5, title='KC MultFactor')
useTrueRange = input(true, title='Use TrueRange (KC)')
// Calculate BB
source = close
basis = ta.sma(source, lengthBB)
dev = multKC * ta.stdev(source, lengthBB)
upperBB = basis + dev
lowerBB = basis - dev
// Calculate KC
ma = ta.sma(source, lengthKC)
range_1 = useTrueRange ? ta.tr : high - low
rangema = ta.sma(range_1, lengthKC)
upperKC = ma + rangema * multKC
lowerKC = ma - rangema * multKC
sqzOn = lowerBB > lowerKC and upperBB < upperKC
sqzOff = lowerBB < lowerKC and upperBB > upperKC
noSqz = sqzOn == false and sqzOff == false
val = ta.linreg(source - math.avg(math.avg(ta.highest(high, lengthKC), ta.lowest(low, lengthKC)), ta.sma(close, lengthKC)), lengthKC, 0)
iff_1 = val > nz(val[1]) ? color.lime : color.green
iff_2 = val < nz(val[1]) ? color.red : color.maroon
bcolor = val > 0 ? iff_1 : iff_2
scolor = noSqz ? color.blue : sqzOn ? color.black : color.gray
//plot(val, color=bcolor, style=plot.style_histogram, linewidth=4)
//plot(0, color=scolor, style=plot.style_cross, linewidth=2)
SQZMOMLongEntry = val > 0
SQZMOMShortEntry = val < 0
// 10 in 1 Different Moving Averages
//░░░░░░░░░░░░░░░░░░░░░░░░░░░░░░░░░░░░░░░░░░░░░░░░░░░░░░░░░░░░░░░░░░░░░░░░░░░░░░░░░░░░░░░░░░░░░░░░░░░░░░░░░░░░░░░░░░░░░░░░░░░░░░░░░░░░░░░░░░░░░░░░░░
// © hiimannshu
//@version=5
// This indicator is just a simple indicator which plot any kind of multiple (atmost 10) moving everage (sma/ema/wma/rma/hma/vwma) on chart.
// Enjoy the new update
//indicator(title='10 in 1 Different Moving Averages ( SMA/EMA/WMA/RMA/HMA/VWMA )', shorttitle=' 10 in 1 MAs', overlay=true)
bool plot_ma_1 = input.bool(true, '', inline='MA 1',group= "Multi Timeframe Moving Averages")
string ma_1_type = input.string(defval='EMA', title='MA 1', options=['RMA', 'SMA', 'EMA', 'WMA','HMA','VWMA'], inline='MA 1',group= "Multi Timeframe Moving Averages")
int ma_1_val = input.int(200, '', minval=1, inline='MA 1',group= "Multi Timeframe Moving Averages")
ma1_tf = input.timeframe(title='', defval='', inline='MA 1',group= "Multi Timeframe Moving Averages")
color ma_1_colour = input.color(color.green, '', inline='MA 1',group= "Multi Timeframe Moving Averages")
bool plot_ma_2 = input.bool(true, '', inline='MA 2',group= "Multi Timeframe Moving Averages")
string ma_2_type = input.string(defval='SMA', title='MA 2 ', options=['RMA', 'SMA', 'EMA', 'WMA','HMA','VWMA'], inline='MA 2',group= "Multi Timeframe Moving Averages")
int ma_2_val = input.int(50, '', minval=1, inline='MA 2',group= "Multi Timeframe Moving Averages")
ma2_tf = input.timeframe(title='', defval='', inline='MA 2',group= "Multi Timeframe Moving Averages")
color ma_2_colour = input.color(color.yellow, '', inline='MA 2',group= "Multi Timeframe Moving Averages")
bool plot_ma_3 = input.bool(false, '', inline='MA 3',group= "Multi Timeframe Moving Averages")
string ma_3_type = input.string(defval='SMA', title='MA 3 ', options=['RMA', 'SMA', 'EMA', 'WMA','HMA','VWMA'], inline='MA 3',group= "Multi Timeframe Moving Averages")
int ma_3_val = input.int(1, '', minval=1, inline='MA 3',group= "Multi Timeframe Moving Averages")
ma3_tf = input.timeframe(title='', defval='', inline='MA 3',group= "Multi Timeframe Moving Averages")
color ma_3_colour = input.color(color.black, '', inline='MA 3',group= "Multi Timeframe Moving Averages")
bool plot_ma_4 = input.bool(false, '', inline='MA 4',group= "Multi Timeframe Moving Averages")
string ma_4_type = input.string(defval='SMA', title='MA 4 ', options=['RMA', 'SMA', 'EMA', 'WMA','HMA','VWMA'], inline='MA 4',group= "Multi Timeframe Moving Averages")
int ma_4_val = input.int(1, '', minval=1, inline='MA 4',group= "Multi Timeframe Moving Averages")
ma4_tf = input.timeframe(title='', defval='', inline='MA 4',group= "Multi Timeframe Moving Averages")
color ma_4_colour = input.color(color.black, '', inline='MA 4',group= "Multi Timeframe Moving Averages")
bool plot_ma_5 = input.bool(false, '', inline='MA 5',group= "Multi Timeframe Moving Averages")
string ma_5_type = input.string(defval='SMA', title='MA 5 ', options=['RMA', 'SMA', 'EMA', 'WMA','HMA','VWMA'], inline='MA 5',group= "Multi Timeframe Moving Averages")
int ma_5_val = input.int(1, '', minval=1, inline='MA 5',group= "Multi Timeframe Moving Averages")
ma5_tf = input.timeframe(title='', defval='', inline='MA 5',group= "Multi Timeframe Moving Averages")
color ma_5_colour = input.color(color.black, '', inline='MA 5',group= "Multi Timeframe Moving Averages")
bool plot_ma_6 = input.bool(false, '', inline='MA 6',group= "Normal Moving Averages")
string ma_6_type = input.string(defval='SMA', title='MA 6 ', options=['RMA', 'SMA', 'EMA', 'WMA','HMA','VWMA'], inline='MA 6',group= "Normal Moving Averages")
int ma_6_val = input.int(1, '', minval=1, inline='MA 6',group= "Normal Moving Averages")
ma_6_src = input.source(defval=close, title='', inline='MA 6',group= "Normal Moving Averages")
color ma_6_colour = input.color(color.black, '', inline='MA 6',group= "Normal Moving Averages")
bool plot_ma_7 = input.bool(false, '', inline='MA 7',group= "Normal Moving Averages")
string ma_7_type = input.string(defval='SMA', title='MA 7 ', options=['RMA', 'SMA', 'EMA', 'WMA','HMA','VWMA'], inline='MA 7',group= "Normal Moving Averages")
int ma_7_val = input.int(1, '', minval=1, inline='MA 7',group= "Normal Moving Averages")
ma_7_src = input.source(defval=close, title='', inline='MA 7',group= "Normal Moving Averages")
color ma_7_colour = input.color(color.black, '', inline='MA 7',group= "Normal Moving Averages")
bool plot_ma_8 = input.bool(false, '', inline='MA 8',group= "Normal Moving Averages")
string ma_8_type = input.string(defval='SMA', title='MA 8', options=['RMA', 'SMA', 'EMA', 'WMA','HMA','VWMA'], inline='MA 8',group= "Normal Moving Averages")
int ma_8_val = input.int(1, '', minval=1, inline='MA 8',group= "Normal Moving Averages")
ma_8_src = input.source(defval=close, title='', inline='MA 8',group= "Normal Moving Averages")
color ma_8_colour = input.color(color.black, '', inline='MA 8',group= "Normal Moving Averages")
bool plot_ma_9 = input.bool(false, '', inline='MA 9',group= "Normal Moving Averages")
string ma_9_type = input.string(defval='SMA', title='MA 9 ', options=['RMA', 'SMA', 'EMA', 'WMA','HMA','VWMA'], inline='MA 9',group= "Normal Moving Averages")
int ma_9_val = input.int(1, '', minval=1, inline='MA 9',group= "Normal Moving Averages")
ma_9_src = input.source(defval=close, title='', inline='MA 9',group= "Normal Moving Averages")
color ma_9_colour = input.color(color.black, '', inline='MA 9',group= "Normal Moving Averages")
bool plot_ma_10 = input.bool(false, '', inline='MA 10',group= "Normal Moving Averages")
string ma_10_type = input.string(defval='SMA', title='MA 10', options=['RMA', 'SMA', 'EMA', 'WMA','HMA','VWMA'], inline='MA 10',group= "Normal Moving Averages")
int ma_10_val = input.int(1, '', minval=1, inline='MA 10',group= "Normal Moving Averages")
ma_10_src = input.source(defval=close, title='', inline='MA 10',group= "Normal Moving Averages")
color ma_10_colour = input.color(color.black, '', inline='MA 10',group= "Normal Moving Averages")
ma_function(source, length, type) =>
if type == 'RMA'
ta.rma(source, length)
else if type == 'SMA'
ta.sma(source, length)
else if type == 'EMA'
ta.ema(source, length)
else if type == 'WMA'
ta.wma(source, length)
else if type == 'HMA'
if(length<2)
ta.hma(source,2)
else
ta.hma(source, length)
else
ta.vwma(source, length)
ma_1 = plot_ma_1 ? request.security(syminfo.tickerid, ma1_tf, ma_function(close, ma_1_val, ma_1_type)):0
ma_2 = plot_ma_2 ?request.security(syminfo.tickerid, ma2_tf, ma_function(close, ma_2_val, ma_2_type)):0
ma_3 = plot_ma_3 ?request.security(syminfo.tickerid, ma3_tf, ma_function(close, ma_3_val, ma_3_type)):0
ma_4 = plot_ma_4 ? request.security(syminfo.tickerid, ma4_tf, ma_function(close, ma_4_val, ma_4_type)):0
ma_5 = plot_ma_5 ?request.security(syminfo.tickerid, ma5_tf, ma_function(close, ma_5_val, ma_5_type)):0
ma_6 = plot_ma_6 ?ma_function(ma_6_src, ma_6_val, ma_6_type):0
ma_7 = plot_ma_7 ?ma_function(ma_7_src, ma_7_val, ma_7_type):0
ma_8 = plot_ma_8 ?ma_function(ma_8_src, ma_8_val, ma_8_type):0
ma_9 = plot_ma_9 ?ma_function(ma_9_src, ma_9_val, ma_9_type):0
ma_10 = plot_ma_10 ?ma_function(ma_10_src, ma_10_val, ma_10_type):0
plot(plot_ma_1 ? ma_1 : na, 'MA 1', ma_1_colour)
plot(plot_ma_2 ? ma_2 : na, 'MA 2', ma_2_colour)
plot(plot_ma_3 ? ma_3 : na, 'MA 3', ma_3_colour)
plot(plot_ma_4 ? ma_4 : na, 'MA 4', ma_4_colour)
plot(plot_ma_5 ? ma_5 : na, 'MA 5', ma_5_colour)
plot(plot_ma_6 ? ma_6 : na, 'MA 6', ma_6_colour)
plot(plot_ma_7 ? ma_7 : na, 'MA 7', ma_7_colour)
plot(plot_ma_8 ? ma_8 : na, 'MA 8', ma_8_colour)
plot(plot_ma_9 ? ma_9 : na, 'MA 9', ma_9_colour)
plot(plot_ma_10 ? ma_10 : na, 'MA 10', ma_10_colour)
// Long entry - Price has to be below both MA's and 50MA needs to be above 200MA
MALongEntry = (close > ma_1 and close > ma_2) and (ma_2 > ma_1)
// Short Entry - Price has to be above both MA's and 50MA needs to be below 200MA
MAShortEntry = (close < ma_1 and close < ma_2) and (ma_2 < ma_1)
// HawkEYE Volume Indicator
//░░░░░░░░░░░░░░░░░░░░░░░░░░░░░░░░░░░░░░░░░░░░░░░░░░░░░░░░░░░░░░░░░░░░░░░░░░░░░░░░░░░░░░░░░░░░░░░░░░░░░░░░░░░░░░░░░░░░░░░░░░░░░░░░░░░░░░░░░░░░░░░░░░
//@version=5
// @author LazyBear
// If you use this code, in its original or modified form, do drop me a note. Thx.
//
//indicator('HawkEye Volume Indicator [LazyBear]', shorttitle='HVI_LB')
lengthhvi = input(200, group="HawkEye Volume Indicator")
range_1HVI = high - low
rangeAvg = ta.sma(range_1HVI, lengthhvi)
volumeA = ta.sma(volume, lengthhvi)
divisor = input(1)
high1 = high[1]
low1 = low[1]
mid1 = hl2[1]
u1 = mid1 + (high1 - low1) / divisor
d1 = mid1 - (high1 - low1) / divisor
r_enabled1 = range_1HVI > rangeAvg and close < d1 and volume > volumeA
r_enabled2 = close < mid1
r_enabled = r_enabled1 or r_enabled2
g_enabled1 = close > mid1
g_enabled2 = range_1HVI > rangeAvg and close > u1 and volume > volumeA
g_enabled3 = high > high1 and range_1HVI < rangeAvg / 1.5 and volume < volumeA
g_enabled4 = low < low1 and range_1HVI < rangeAvg / 1.5 and volume > volumeA
g_enabled = g_enabled1 or g_enabled2 or g_enabled3 or g_enabled4
gr_enabled1 = range_1HVI > rangeAvg and close > d1 and close < u1 and volume > volumeA and volume < volumeA * 1.5 and volume > volume[1]
gr_enabled2 = range_1HVI < rangeAvg / 1.5 and volume < volumeA / 1.5
gr_enabled3 = close > d1 and close < u1
gr_enabled = gr_enabled1 or gr_enabled2 or gr_enabled3
v_color = gr_enabled ? color.gray : g_enabled ? color.green : r_enabled ? color.red : color.blue
//plot(volume, style=plot.style_histogram, color=v_color, linewidth=5)
HVILongEntry = g_enabled
HVIShortEntry = r_enabled
//////////////////////////////////////
//* Put your strategy rules below *//
/////////////////////////////////////
longCondition = PSARLongEntry and MALongEntry and HVILongEntry and SQZMOMLongEntry
shortCondition = PSARShortEntry and MAShortEntry and HVIShortEntry and SQZMOMShortEntry
//define as 0 if do not want to use
closeLongCondition = 0
closeShortCondition = 0
// ADX
//░░░░░░░░░░░░░░░░░░░░░░░░░░░░░░░░░░░░░░░░░░░░░░░░░░░░░░░░░░░░░░░░░░░░░░░░░░░░░░░░░░░░░░░░░░░░░░░░░░░░░░░░░░░░░░░░░░░░░░░░░░░░░░░░░░░░░░░░░░░░░░░░░░
adxEnabled = input.bool(defval = false , title = "Average Directional Index (ADX)", tooltip = "", group ="ADX" )
adxlen = input(14, title="ADX Smoothing", group="ADX")
adxdilen = input(14, title="DI Length", group="ADX")
adxabove = input(25, title="ADX Threshold", group="ADX")
adxdirmov(len) =>
adxup = ta.change(high)
adxdown = -ta.change(low)
adxplusDM = na(adxup) ? na : (adxup > adxdown and adxup > 0 ? adxup : 0)
adxminusDM = na(adxdown) ? na : (adxdown > adxup and adxdown > 0 ? adxdown : 0)
adxtruerange = ta.rma(ta.tr, len)
adxplus = fixnan(100 * ta.rma(adxplusDM, len) / adxtruerange)
adxminus = fixnan(100 * ta.rma(adxminusDM, len) / adxtruerange)
[adxplus, adxminus]
adx(adxdilen, adxlen) =>
[adxplus, adxminus] = adxdirmov(adxdilen)
adxsum = adxplus + adxminus
adx = 100 * ta.rma(math.abs(adxplus - adxminus) / (adxsum == 0 ? 1 : adxsum), adxlen)
adxsig = adxEnabled ? adx(adxdilen, adxlen) : na
isADXEnabledAndAboveThreshold = adxEnabled ? (adxsig > adxabove) : true
//Backtesting Time Period (Input.time not working as expected as of 03/30/2021. Giving odd start/end dates
//░░░░░░░░░░░░░░░░░░░░░░░░░░░░░░░░░░░░░░░░░░░░░░░░░░░░░░░░░░░░░░░░░░░░░░░░░░░░░░░░░░░░░░░░░░░░░░░░░░░░░░░░░░░░░░░░░░░░░░░░░░░░░░░░░░░░░░░░░░░░░░░░░░
useStartPeriodTime = input.bool(true, 'Start', group='Date Range', inline='Start Period')
startPeriodTime = input(timestamp('1 Jan 2019'), '', group='Date Range', inline='Start Period')
useEndPeriodTime = input.bool(true, 'End', group='Date Range', inline='End Period')
endPeriodTime = input(timestamp('31 Dec 2030'), '', group='Date Range', inline='End Period')
start = useStartPeriodTime ? startPeriodTime >= time : false
end = useEndPeriodTime ? endPeriodTime <= time : false
calcPeriod = true
// Trade Direction
// ░░░░░░░░░░░░░░░░░░░░░░░░░░░░░░░░░░░░░░░░░░░░░░░░░░░░░░░░░░░░░░░░░░░░░░░░░░░░░░░░░░░░░░░░░░░░░░░░░░░░░░░░░░░░░░░░░░░░░░░░░░░░░░░░░░░░░░░░░░░░░░░░░░
tradeDirection = input.string('Long and Short', title='Trade Direction', options=['Long and Short', 'Long Only', 'Short Only'], group='Trade Direction')
// Percent as Points
// ░░░░░░░░░░░░░░░░░░░░░░░░░░░░░░░░░░░░░░░░░░░░░░░░░░░░░░░░░░░░░░░░░░░░░░░░░░░░░░░░░░░░░░░░░░░░░░░░░░░░░░░░░░░░░░░░░░░░░░░░░░░░░░░░░░░░░░░░░░░░░░░░░░
per(pcnt) =>
strategy.position_size != 0 ? math.round(pcnt / 100 * strategy.position_avg_price / syminfo.mintick) : float(na)
// Take profit 1
// ░░░░░░░░░░░░░░░░░░░░░░░░░░░░░░░░░░░░░░░░░░░░░░░░░░░░░░░░░░░░░░░░░░░░░░░░░░░░░░░░░░░░░░░░░░░░░░░░░░░░░░░░░░░░░░░░░░░░░░░░░░░░░░░░░░░░░░░░░░░░░░░░░░
tp1 = input.float(title='Take Profit 1 - Target %', defval=100, minval=0.0, step=0.5, group='Take Profit', inline='Take Profit 1')
q1 = input.int(title='% Of Position', defval=100, minval=0, group='Take Profit', inline='Take Profit 1')
// Take profit 2
// ░░░░░░░░░░░░░░░░░░░░░░░░░░░░░░░░░░░░░░░░░░░░░░░░░░░░░░░░░░░░░░░░░░░░░░░░░░░░░░░░░░░░░░░░░░░░░░░░░░░░░░░░░░░░░░░░░░░░░░░░░░░░░░░░░░░░░░░░░░░░░░░░░░
tp2 = input.float(title='Take Profit 2 - Target %', defval=100, minval=0.0, step=0.5, group='Take Profit', inline='Take Profit 2')
q2 = input.int(title='% Of Position', defval=100, minval=0, group='Take Profit', inline='Take Profit 2')
// Take profit 3
// ░░░░░░░░░░░░░░░░░░░░░░░░░░░░░░░░░░░░░░░░░░░░░░░░░░░░░░░░░░░░░░░░░░░░░░░░░░░░░░░░░░░░░░░░░░░░░░░░░░░░░░░░░░░░░░░░░░░░░░░░░░░░░░░░░░░░░░░░░░░░░░░░░░
tp3 = input.float(title='Take Profit 3 - Target %', defval=100, minval=0.0, step=0.5, group='Take Profit', inline='Take Profit 3')
q3 = input.int(title='% Of Position', defval=100, minval=0, group='Take Profit', inline='Take Profit 3')
// Take profit 4
// ░░░░░░░░░░░░░░░░░░░░░░░░░░░░░░░░░░░░░░░░░░░░░░░░░░░░░░░░░░░░░░░░░░░░░░░░░░░░░░░░░░░░░░░░░░░░░░░░░░░░░░░░░░░░░░░░░░░░░░░░░░░░░░░░░░░░░░░░░░░░░░░░░░
tp4 = input.float(title='Take Profit 4 - Target %', defval=100, minval=0.0, step=0.5, group='Take Profit')
/// Stop Loss
// ░░░░░░░░░░░░░░░░░░░░░░░░░░░░░░░░░░░░░░░░░░░░░░░░░░░░░░░░░░░░░░░░░░░░░░░░░░░░░░░░░░░░░░░░░░░░░░░░░░░░░░░░░░░░░░░░░░░░░░░░░░░░░░░░░░░░░░░░░░░░░░░░░░
stoplossPercent = input.float(title='Stop Loss (%)', defval=999, minval=0.01, group='Stop Loss') * 0.01
slLongClose = close < strategy.position_avg_price * (1 - stoplossPercent)
slShortClose = close > strategy.position_avg_price * (1 + stoplossPercent)
/// Leverage
// ░░░░░░░░░░░░░░░░░░░░░░░░░░░░░░░░░░░░░░░░░░░░░░░░░░░░░░░░░░░░░░░░░░░░░░░░░░░░░░░░░░░░░░░░░░░░░░░░░░░░░░░░░░░░░░░░░░░░░░░░░░░░░░░░░░░░░░░░░░░░░░░░░░
leverage = input.float(1, 'Leverage', step=.5, group='Leverage')
contracts = math.min(math.max(.000001, strategy.equity / close * leverage), 1000000000)
/// Trade State Management
// ░░░░░░░░░░░░░░░░░░░░░░░░░░░░░░░░░░░░░░░░░░░░░░░░░░░░░░░░░░░░░░░░░░░░░░░░░░░░░░░░░░░░░░░░░░░░░░░░░░░░░░░░░░░░░░░░░░░░░░░░░░░░░░░░░░░░░░░░░░░░░░░░░░
isInLongPosition = strategy.position_size > 0
isInShortPosition = strategy.position_size < 0
/// ProfitView Alert Syntax String Generation
// ░░░░░░░░░░░░░░░░░░░░░░░░░░░░░░░░░░░░░░░░░░░░░░░░░░░░░░░░░░░░░░░░░░░░░░░░░░░░░░░░░░░░░░░░░░░░░░░░░░░░░░░░░░░░░░░░░░░░░░░░░░░░░░░░░░░░░░░░░░░░░░░░░░
alertSyntaxPrefix = input.string(defval='CRYPTANEX_99FTX_Strategy-Name-Here', title='Alert Syntax Prefix', group='ProfitView Alert Syntax')
alertSyntaxBase = alertSyntaxPrefix + '\n#' + str.tostring(open) + ',' + str.tostring(high) + ',' + str.tostring(low) + ',' + str.tostring(close) + ',' + str.tostring(volume) + ','
/// Trade Execution
// ░░░░░░░░░░░░░░░░░░░░░░░░░░░░░░░░░░░░░░░░░░░░░░░░░░░░░░░░░░░░░░░░░░░░░░░░░░░░░░░░░░░░░░░░░░░░░░░░░░░░░░░░░░░░░░░░░░░░░░░░░░░░░░░░░░░░░░░░░░░░░░░░░░
longConditionCalc = (longCondition and isADXEnabledAndAboveThreshold)
shortConditionCalc = (shortCondition and isADXEnabledAndAboveThreshold)
if calcPeriod
if longConditionCalc and tradeDirection != 'Short Only' and isInLongPosition == false
strategy.entry('Long', strategy.long, qty=contracts)
alert(message=alertSyntaxBase + 'side:long', freq=alert.freq_once_per_bar_close)
if shortConditionCalc and tradeDirection != 'Long Only' and isInShortPosition == false
strategy.entry('Short', strategy.short, qty=contracts)
alert(message=alertSyntaxBase + 'side:short', freq=alert.freq_once_per_bar_close)
//Inspired from Multiple %% profit exits example by adolgo https://www.tradingview.com/script/kHhCik9f-Multiple-profit-exits-example/
strategy.exit('TP1', qty_percent=q1, profit=per(tp1))
strategy.exit('TP2', qty_percent=q2, profit=per(tp2))
strategy.exit('TP3', qty_percent=q3, profit=per(tp3))
strategy.exit('TP4', profit=per(tp4))
strategy.close('Long', qty_percent=100, comment='SL Long', when=slLongClose)
strategy.close('Short', qty_percent=100, comment='SL Short', when=slShortClose)
strategy.close_all(when=closeLongCondition or closeShortCondition, comment='Close Postion')
/// Dashboard
// ░░░░░░░░░░░░░░░░░░░░░░░░░░░░░░░░░░░░░░░░░░░░░░░░░░░░░░░░░░░░░░░░░░░░░░░░░░░░░░░░░░░░░░░░░░░░░░░░░░░░░░░░░░░░░░░░░░░░░░░░░░░░░░░░░░░░░░░░░░░░░░░░░░
// Inspired by https://www.tradingview.com/script/uWqKX6A2/ - Thanks VertMT