Indicador de divergência longa e curta do RSI
Visão geral
O RSI é uma estratégia de negociação quantitativa baseada em um indicador relativamente forte (RSI). Analisa a divergência entre o RSI e o preço para encontrar oportunidades de reversão de tendências de preços e realizar baixas e vendas.
Princípio da estratégia
O indicador central da estratégia é o RSI. Ele analisa o fosso de divergência entre o indicador RSI e o preço. O chamado fosso de divergência é o sinal de inversão entre o indicador RSI e o preço.
Concretamente, quando o RSI forma baixos mais baixos e o preço forma baixos mais altos, é uma divergência entre o RSI e o preço. Isso indica que o preço pode reverter para cima. A estratégia cria uma posição de múltiplas posições neste momento.
Em vez disso, quando o RSI forma um alto mais alto e o preço forma um alto mais baixo, é a divergência entre o RSI e o preço. Isso indica que o preço pode reverter a queda. A estratégia cria uma posição de posição em aberto neste momento.
Ao capturar esses pontos de divergência entre o RSI e o preço, a estratégia pode detectar oportunidades de reversão de preço em tempo hábil, para alcançar um preço de compra e venda baixo.
Vantagens estratégicas
A estratégia de divergência com mais espaço do RSI tem as seguintes vantagens:
Capturar os pontos de reversão de preços com precisão. O RSI e a divergência de preços geralmente indicam uma reversão de tendência iminente, o que é um sinal de previsão muito eficaz.
Comprar baixo e vender alto. Construir uma posição através de pontos de divergência para comprar em pontos relativamente baixos e vender em pontos relativamente altos, de acordo com as melhores práticas de negociação quantitativa.
A estratégia RSI convencional foca apenas nas áreas de sobrevenda e sobrecompra. A estratégia RSI convencional usa a propriedade de inversão do RSI para capturar os pontos de inflexão de forma mais precisa. A eficiência da estratégia é muito maior.
A configuração de parâmetros simples. Os principais parâmetros são apenas os dois períodos RSI e o intervalo de retrospectiva, muito simples e fácil de otimizar.
Risco estratégico
A estratégia de divergência com o RSI também tem riscos:
Os sinais de divergência podem ser falsos. A divergência entre o RSI e o preço não necessariamente leva a uma verdadeira inversão de preço. Às vezes, uma falsa inversão também pode ser formada. Isso pode levar a uma perda de negociação.
Quando o preço da ação aparece uma tendência clara, o espaço de lucro da estratégia será menor. Nesse caso, é melhor suspender a estratégia e esperar por novas situações de choque.
Risco de retorno. A estratégia define parâmetros de retorno que podem acelerar a perda da conta se ocorrer várias operações perdedoras. Isso requer controle do tamanho da posição e do ponto de parada para reduzir o risco.
Otimização de Estratégia
A estratégia também pode ser melhorada nos seguintes aspectos:
Em combinação com outros indicadores, os sinais de filtragem podem ser adicionados a outros indicadores, como MACD, KDJ, etc., para verificar os pontos de divergência do RSI, filtrar alguns sinais falsos e melhorar a taxa de vitória da estratégia.
Optimizar os parâmetros do RSI. Pode-se testar diferentes parâmetros do ciclo do RSI para encontrar a configuração do ciclo do RSI que melhor se encaixa com as características da variedade.
Optimizar o intervalo de revisão. O intervalo de revisão afeta diretamente a frequência de negociação da estratégia.
Aumentar a estratégia de parada. Pode-se definir uma lógica de parada razoável de acordo com o ATR, a parada móvel, etc. A parada rápida em caso de perda pode controlar eficazmente o risco da estratégia.
Resumir
A estratégia de divergência de RSI de muitos espaços capta com precisão os pontos de inflexão das mudanças de preço através da análise da inversão do próprio indicador RSI. Realiza uma estratégia de negociação de compra e venda de baixo preço. Em comparação com a estratégia de compra e venda de RSI no sentido tradicional, usa características mais refinadas e primitivas do RSI, aumentando significativamente a eficiência da estratégia.
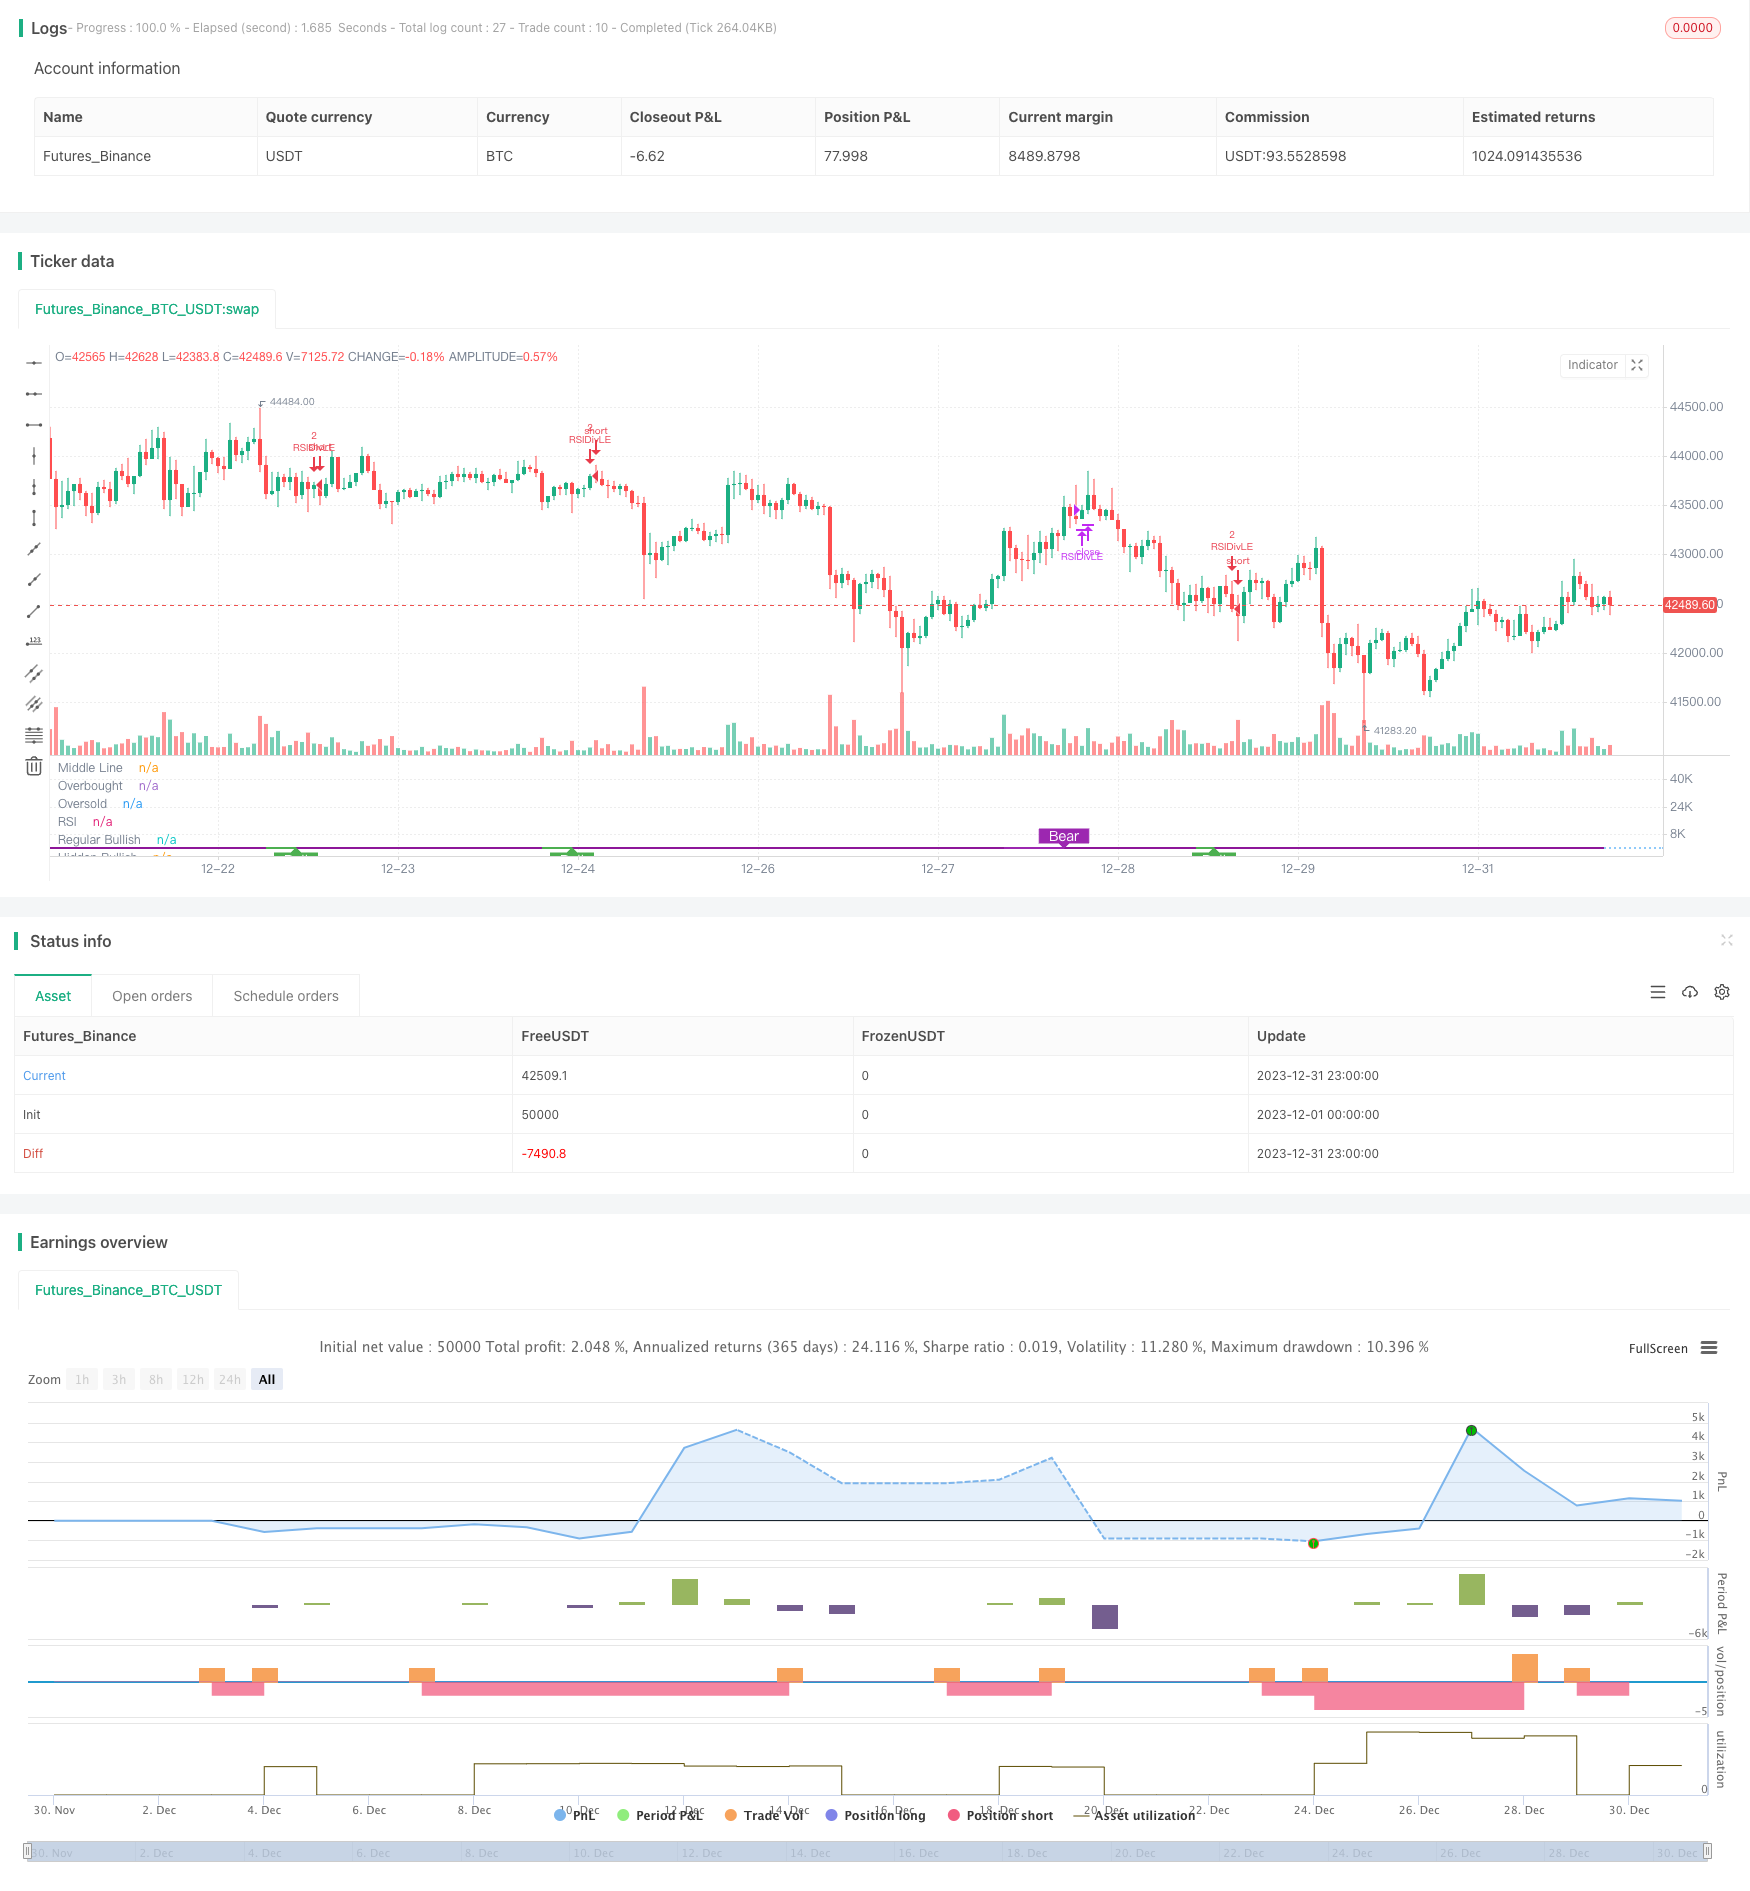
/*backtest
start: 2023-12-01 00:00:00
end: 2023-12-31 23:59:59
period: 1h
basePeriod: 15m
exchanges: [{"eid":"Futures_Binance","currency":"BTC_USDT"}]
*/

//@version=4
//study(title="Divergence Indicator", format=format.price)
//GOOGL setting  5 , close, 3 , 1  profitLevel at 75 shows win rate  87.21 %  profit factor 7.059
//GOOGL setting  8 , close, 3 , 1  profitLevel at 80 shows win rate  86.57 %  profit factor 18.96
//SPY setting    5, close , 3, 3  profitLevel at 70  , shows win rate 80.34%  profit factor 2.348
strategy(title="RSI Divergence Indicator", overlay=false,pyramiding=2, default_qty_value=2,   default_qty_type=strategy.fixed, initial_capital=10000, currency=currency.USD)

len = input(title="RSI Period", minval=1, defval=9)
src = input(title="RSI Source", defval=close)
lbR = input(title="Pivot Lookback Right", defval=3)
lbL = input(title="Pivot Lookback Left", defval=1)
takeProfitRSILevel = input(title="Take Profit at RSI Level", minval=70, defval=80)

rangeUpper = input(title="Max of Lookback Range", defval=60)
rangeLower = input(title="Min of Lookback Range", defval=5)
plotBull = input(title="Plot Bullish", defval=true)
plotHiddenBull = input(title="Plot Hidden Bullish", defval=true)
plotBear = input(title="Plot Bearish", defval=true)
plotHiddenBear = input(title="Plot Hidden Bearish", defval=false)

//useTrailStopLoss = input(false, title="Use Trailing Stop Loss")

sl_type = input("NONE", title="Trailing StopLoss Type", options=['ATR','PERC', 'NONE'])

stopLoss = input(title="Stop Loss%", defval=5, minval=1)

atrLength=input(14, title="ATR Length (for Trailing stop loss)")
atrMultiplier=input(3.5, title="ATR Multiplier (for Trailing stop loss)")


bearColor = color.purple
bullColor = color.green
hiddenBullColor = color.new(color.green, 80)
hiddenBearColor = color.new(color.red, 80)
textColor = color.white
noneColor = color.new(color.white, 100)

osc = rsi(src, len)

plot(osc, title="RSI", linewidth=2, color=#8D1699)
hline(50, title="Middle Line", linestyle=hline.style_dotted)
obLevel = hline(70, title="Overbought", linestyle=hline.style_dotted)
osLevel = hline(30, title="Oversold", linestyle=hline.style_dotted)
fill(obLevel, osLevel, title="Background", color=#9915FF, transp=90)

plFound = na(pivotlow(osc, lbL, lbR)) ? false : true
phFound = na(pivothigh(osc, lbL, lbR)) ? false : true

_inRange(cond) =>
    bars = barssince(cond == true)
    rangeLower <= bars and bars <= rangeUpper

//------------------------------------------------------------------------------
// Regular Bullish

// Osc: Higher Low
oscHL = osc[lbR] > valuewhen(plFound, osc[lbR], 1) and _inRange(plFound[1])

// Price: Lower Low
priceLL = low[lbR] < valuewhen(plFound, low[lbR], 1)

bullCond = plotBull and priceLL and oscHL and plFound

plot(
	 plFound ? osc[lbR] : na,
	 offset=-lbR,
	 title="Regular Bullish",
	 linewidth=2,
	 color=(bullCond ? bullColor : noneColor),
	 transp=0
	 )


plotshape(
	 bullCond ? osc[lbR] : na,
	 offset=-lbR,
	 title="Regular Bullish Label",
	 text=" Bull ",
	 style=shape.labelup,
	 location=location.absolute,
	 color=bullColor,
	 textcolor=textColor,
	 transp=0
	 )

//------------------------------------------------------------------------------
// Hidden Bullish

// Osc: Lower Low
oscLL = osc[lbR] < valuewhen(plFound, osc[lbR], 1) and _inRange(plFound[1])

// Price: Higher Low
priceHL = low[lbR] > valuewhen(plFound, low[lbR], 1)

hiddenBullCond = plotHiddenBull and priceHL and oscLL and plFound

plot(
	 plFound ? osc[lbR] : na,
	 offset=-lbR,
	 title="Hidden Bullish",
	 linewidth=2,
	 color=(hiddenBullCond ? hiddenBullColor : noneColor),
	 transp=0
	 )

plotshape(
	 hiddenBullCond ? osc[lbR] : na,
	 offset=-lbR,
	 title="Hidden Bullish Label",
	 text=" H Bull ",
	 style=shape.labelup,
	 location=location.absolute,
	 color=bullColor,
	 textcolor=textColor,
	 transp=0
	 )

longCondition=bullCond or hiddenBullCond
//? osc[lbR] : na
//hiddenBullCond
strategy.entry(id="RSIDivLE", long=true,  when=longCondition)


//Trailing StopLoss
////// Calculate trailing SL
/////////////////////////////////////////////////////
sl_val = sl_type == "ATR"      ? stopLoss * atr(atrLength) :
         sl_type == "PERC" ? close * stopLoss / 100 : 0.00

trailing_sl = 0.0
trailing_sl :=   strategy.position_size>=1 ?  max(low  - sl_val, nz(trailing_sl[1])) :  na

//draw initil stop loss
//plot(strategy.position_size>=1 ? trailing_sl : na, color = color.blue , style=plot.style_linebr,  linewidth = 2, title = "stop loss")
//plot(trailing_sl, title="ATR Trailing Stop Loss", style=plot.style_linebr, linewidth=1, color=color.purple, transp=30)
//Trailing StopLoss
////// Calculate trailing SL
/////////////////////////////////////////////////////


//------------------------------------------------------------------------------
// Regular Bearish

// Osc: Lower High
oscLH = osc[lbR] < valuewhen(phFound, osc[lbR], 1) and _inRange(phFound[1])

// Price: Higher High
priceHH = high[lbR] > valuewhen(phFound, high[lbR], 1)

bearCond = plotBear and priceHH and oscLH and phFound

plot(
	 phFound ? osc[lbR] : na,
	 offset=-lbR,
	 title="Regular Bearish",
	 linewidth=2,
	 color=(bearCond ? bearColor : noneColor),
	 transp=0
	 )

plotshape(
	 bearCond ? osc[lbR] : na,
	 offset=-lbR,
	 title="Regular Bearish Label",
	 text=" Bear ",
	 style=shape.labeldown,
	 location=location.absolute,
	 color=bearColor,
	 textcolor=textColor,
	 transp=0
	 )

//------------------------------------------------------------------------------
// Hidden Bearish

// Osc: Higher High
oscHH = osc[lbR] > valuewhen(phFound, osc[lbR], 1) and _inRange(phFound[1])

// Price: Lower High
priceLH = high[lbR] < valuewhen(phFound, high[lbR], 1)

hiddenBearCond = plotHiddenBear and priceLH and oscHH and phFound

plot(
	 phFound ? osc[lbR] : na,
	 offset=-lbR,
	 title="Hidden Bearish",
	 linewidth=2,
	 color=(hiddenBearCond ? hiddenBearColor : noneColor),
	 transp=0
	 )

plotshape(
	 hiddenBearCond ? osc[lbR] : na,
	 offset=-lbR,
	 title="Hidden Bearish Label",
	 text=" H Bear ",
	 style=shape.labeldown,
	 location=location.absolute,
	 color=bearColor,
	 textcolor=textColor,
	 transp=0
	 )
longCloseCondition=crossover(osc,takeProfitRSILevel) or bearCond
strategy.close(id="RSIDivLE", comment="Close All="+tostring(close - strategy.position_avg_price, "####.##"), when= abs(strategy.position_size)>=1  and  sl_type == "NONE" and longCloseCondition)

//close all on stop loss
strategy.close(id="RSIDivLE", comment="TSL="+tostring(close - strategy.position_avg_price, "####.##"),  when=abs(strategy.position_size)>=1 and (sl_type == "PERC"   or sl_type == "ATR" ) and crossunder(close, trailing_sl)  )  //close<ema55 and rsi5Val<20 //ema34<ema55  //close<ema89


// Calculate start/end date and time condition
startDate  = input(timestamp("2019-01-01T00:00:00"), type = input.time)
finishDate = input(timestamp("2021-01-01T00:00:00"), type = input.time)

time_cond  = time >= startDate and time <= finishDate