Индикатор дивергенции ИРС
Автор:Чао Чжан, Дата: 2021-05-31 18:54:21Тэги:РСИПериод
Спасибо Мохани за базовый код. Мы изменили его, чтобы не давать предупреждения о входе, а вместо этого предупреждать только о самих DIV.
Очень хорошо работает с детектором AO div.
обратная проверка
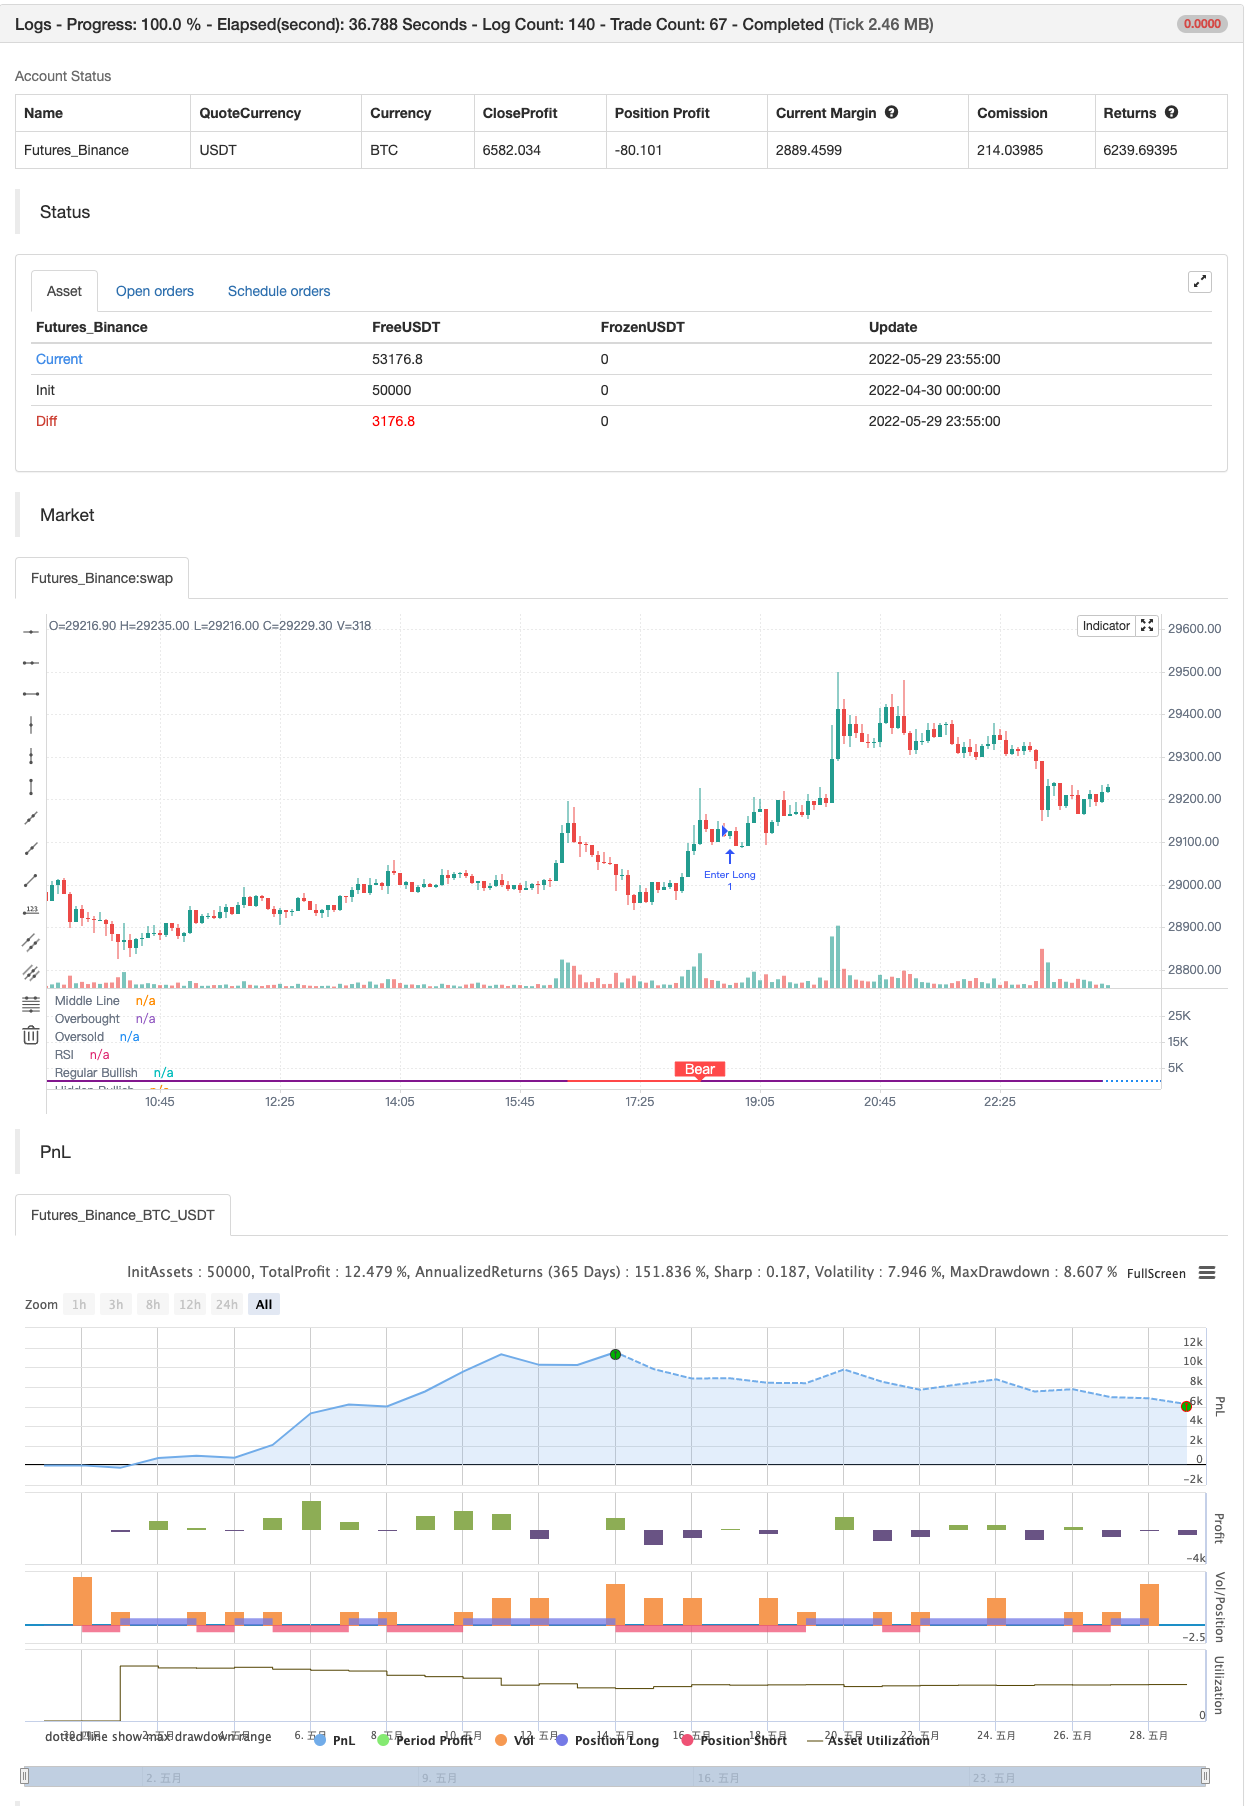
/*backtest
start: 2022-04-30 00:00:00
end: 2022-05-29 23:59:00
period: 5m
basePeriod: 1m
exchanges: [{"eid":"Futures_Binance","currency":"BTC_USDT"}]
*/

// This source code is subject to the terms of the Mozilla Public License 2.0 at https://mozilla.org/MPL/2.0/
// © JayTradingCharts

//@version=4
//@version=4
//---- thank to mohanee for the base code. we modified this to not give entries but instead alert on the just the divs
study(title="RSI Divergence Indicator w/Alerts", format=format.price, resolution="")
len = input(title="RSI Period", minval=1, defval=14)
src = input(title="RSI Source", defval=close)
lbR = input(title="Pivot Lookback Right", defval=5)
lbL = input(title="Pivot Lookback Left", defval=5)
rangeUpper = input(title="Max of Lookback Range", defval=60)
rangeLower = input(title="Min of Lookback Range", defval=5)
plotBull = input(title="Plot Bullish", defval=true)
plotHiddenBull = input(title="Plot Hidden Bullish", defval=false)
plotBear = input(title="Plot Bearish", defval=true)
plotHiddenBear = input(title="Plot Hidden Bearish", defval=false)
bearColor = color.red
bullColor = color.green
hiddenBullColor = color.new(color.green, 80)
hiddenBearColor = color.new(color.red, 80)
textColor = color.white
noneColor = color.new(color.white, 100)
osc = rsi(src, len)

plot(osc, title="RSI", linewidth=2, color=#8D1699)
hline(50, title="Middle Line", linestyle=hline.style_dotted)
obLevel = hline(70, title="Overbought", linestyle=hline.style_dotted)
osLevel = hline(30, title="Oversold", linestyle=hline.style_dotted)
fill(obLevel, osLevel, title="Background", color=#9915FF, transp=90)

plFound = na(pivotlow(osc, lbL, lbR)) ? false : true
phFound = na(pivothigh(osc, lbL, lbR)) ? false : true
_inRange(cond) =>
	bars = barssince(cond == true)
	rangeLower <= bars and bars <= rangeUpper

//------------------------------------------------------------------------------
// Regular Bullish
// Osc: Higher Low

oscHL = osc[lbR] > valuewhen(plFound, osc[lbR], 1) and _inRange(plFound[1])

// Price: Lower Low

priceLL = low[lbR] < valuewhen(plFound, low[lbR], 1)
bullCond = plotBull and priceLL and oscHL and plFound

plot(
     plFound ? osc[lbR] : na,
     offset=-lbR,
     title="Regular Bullish",
     linewidth=2,
     color=(bullCond ? bullColor : noneColor),
     transp=0
     )

plotshape(
	 bullCond ? osc[lbR] : na,
	 offset=-lbR,
	 title="Regular Bullish Label",
	 text=" Bull ",
	 style=shape.labelup,
	 location=location.absolute,
	 color=bullColor,
	 textcolor=textColor,
	 transp=0
	 )

//------------------------------------------------------------------------------
// Hidden Bullish
// Osc: Lower Low

oscLL = osc[lbR] < valuewhen(plFound, osc[lbR], 1) and _inRange(plFound[1])

// Price: Higher Low

priceHL = low[lbR] > valuewhen(plFound, low[lbR], 1)
hiddenBullCond = plotHiddenBull and priceHL and oscLL and plFound

plot(
	 plFound ? osc[lbR] : na,
	 offset=-lbR,
	 title="Hidden Bullish",
	 linewidth=2,
	 color=(hiddenBullCond ? hiddenBullColor : noneColor),
	 transp=0
	 )

plotshape(
	 hiddenBullCond ? osc[lbR] : na,
	 offset=-lbR,
	 title="Hidden Bullish Label",
	 text=" H Bull ",
	 style=shape.labelup,
	 location=location.absolute,
	 color=bullColor,
	 textcolor=textColor,
	 transp=0
	 )

//------------------------------------------------------------------------------
// Regular Bearish
// Osc: Lower High

oscLH = osc[lbR] < valuewhen(phFound, osc[lbR], 1) and _inRange(phFound[1])

// Price: Higher High

priceHH = high[lbR] > valuewhen(phFound, high[lbR], 1)

bearCond = plotBear and priceHH and oscLH and phFound

plot(
	 phFound ? osc[lbR] : na,
	 offset=-lbR,
	 title="Regular Bearish",
	 linewidth=2,
	 color=(bearCond ? bearColor : noneColor),
	 transp=0
	 )

plotshape(
	 bearCond ? osc[lbR] : na,
	 offset=-lbR,
	 title="Regular Bearish Label",
	 text=" Bear ",
	 style=shape.labeldown,
	 location=location.absolute,
	 color=bearColor,
	 textcolor=textColor,
	 transp=0
	 )

//------------------------------------------------------------------------------
// Hidden Bearish
// Osc: Higher High

oscHH = osc[lbR] > valuewhen(phFound, osc[lbR], 1) and _inRange(phFound[1])

// Price: Lower High

priceLH = high[lbR] < valuewhen(phFound, high[lbR], 1)

hiddenBearCond = plotHiddenBear and priceLH and oscHH and phFound

plot(
	 phFound ? osc[lbR] : na,
	 offset=-lbR,
	 title="Hidden Bearish",
	 linewidth=2,
	 color=(hiddenBearCond ? hiddenBearColor : noneColor),
	 transp=0
	 )

plotshape(
	 hiddenBearCond ? osc[lbR] : na,
	 offset=-lbR,
	 title="Hidden Bearish Label",
	 text=" H Bear ",
	 style=shape.labeldown,
	 location=location.absolute,
	 color=bearColor,
	 textcolor=textColor,
	 transp=0
	 )


alertcondition(bullCond, title="Bull", message="Regular Bull Div {{ticker}} XXmin")
alertcondition(bearCond, title="Bear", message="Regular Bear Div {{ticker}} XXmin")
alertcondition(hiddenBullCond, title="H Bull", message="Hidden Bull Div {{ticker}} XXmin")
alertcondition(hiddenBearCond, title="H Bear", message="Hidden Bear Div {{ticker}} XXmin")


if bearCond
    strategy.entry("Enter Long", strategy.long)
else if bullCond
    strategy.entry("Enter Short", strategy.short)
Связанные
- Стратегия изменения направления РСИ
- Статистические стратегии RSI
- РСИ МФО Ob+Os
- RSI - Сигналы покупки и продажи
- Стратегия индекса относительной силы RSI
- Супертрекс
- TMA-Legacy
- РСИ МФО Ob+Os
- Стратегия высокочастотного реверсивного трейдинга на основе индикатора импульса RSI
- Болинджер + RSI, двойная стратегия v1.1
Больше
- Фильтр двойного диапазона
- SAR - высокий и низкий
- Точная система торговли суицидом
- Линейная тенденция
- Модель фибоначчи
- Купить и продать
- Индикатор настройки демарка
- Болинджерские полосы Стохастический RSI Extreme
- Индикатор AK MACD BB V 1,00
- Параболический SAR
- Индикатор OBV MACD
- Периодическая тенденция
- Стратегия ценовой дивергенции v1.0
- Прорыв поддержки-сопротивления
- Адаптивная скользящая средняя
- Стратегия осциллятора Delta-RSI
- Стратегия крипто с низким сканером
- [Черная кошка] L2 Стратегия обратной маркировки
- Супер-Б
- Высокий Низкий SAR