zdmre کی طرف سے RSI
مصنف:چاؤ ژانگ، تاریخ: 2022-05-13 16:34:43ٹیگز:آر ایم اے
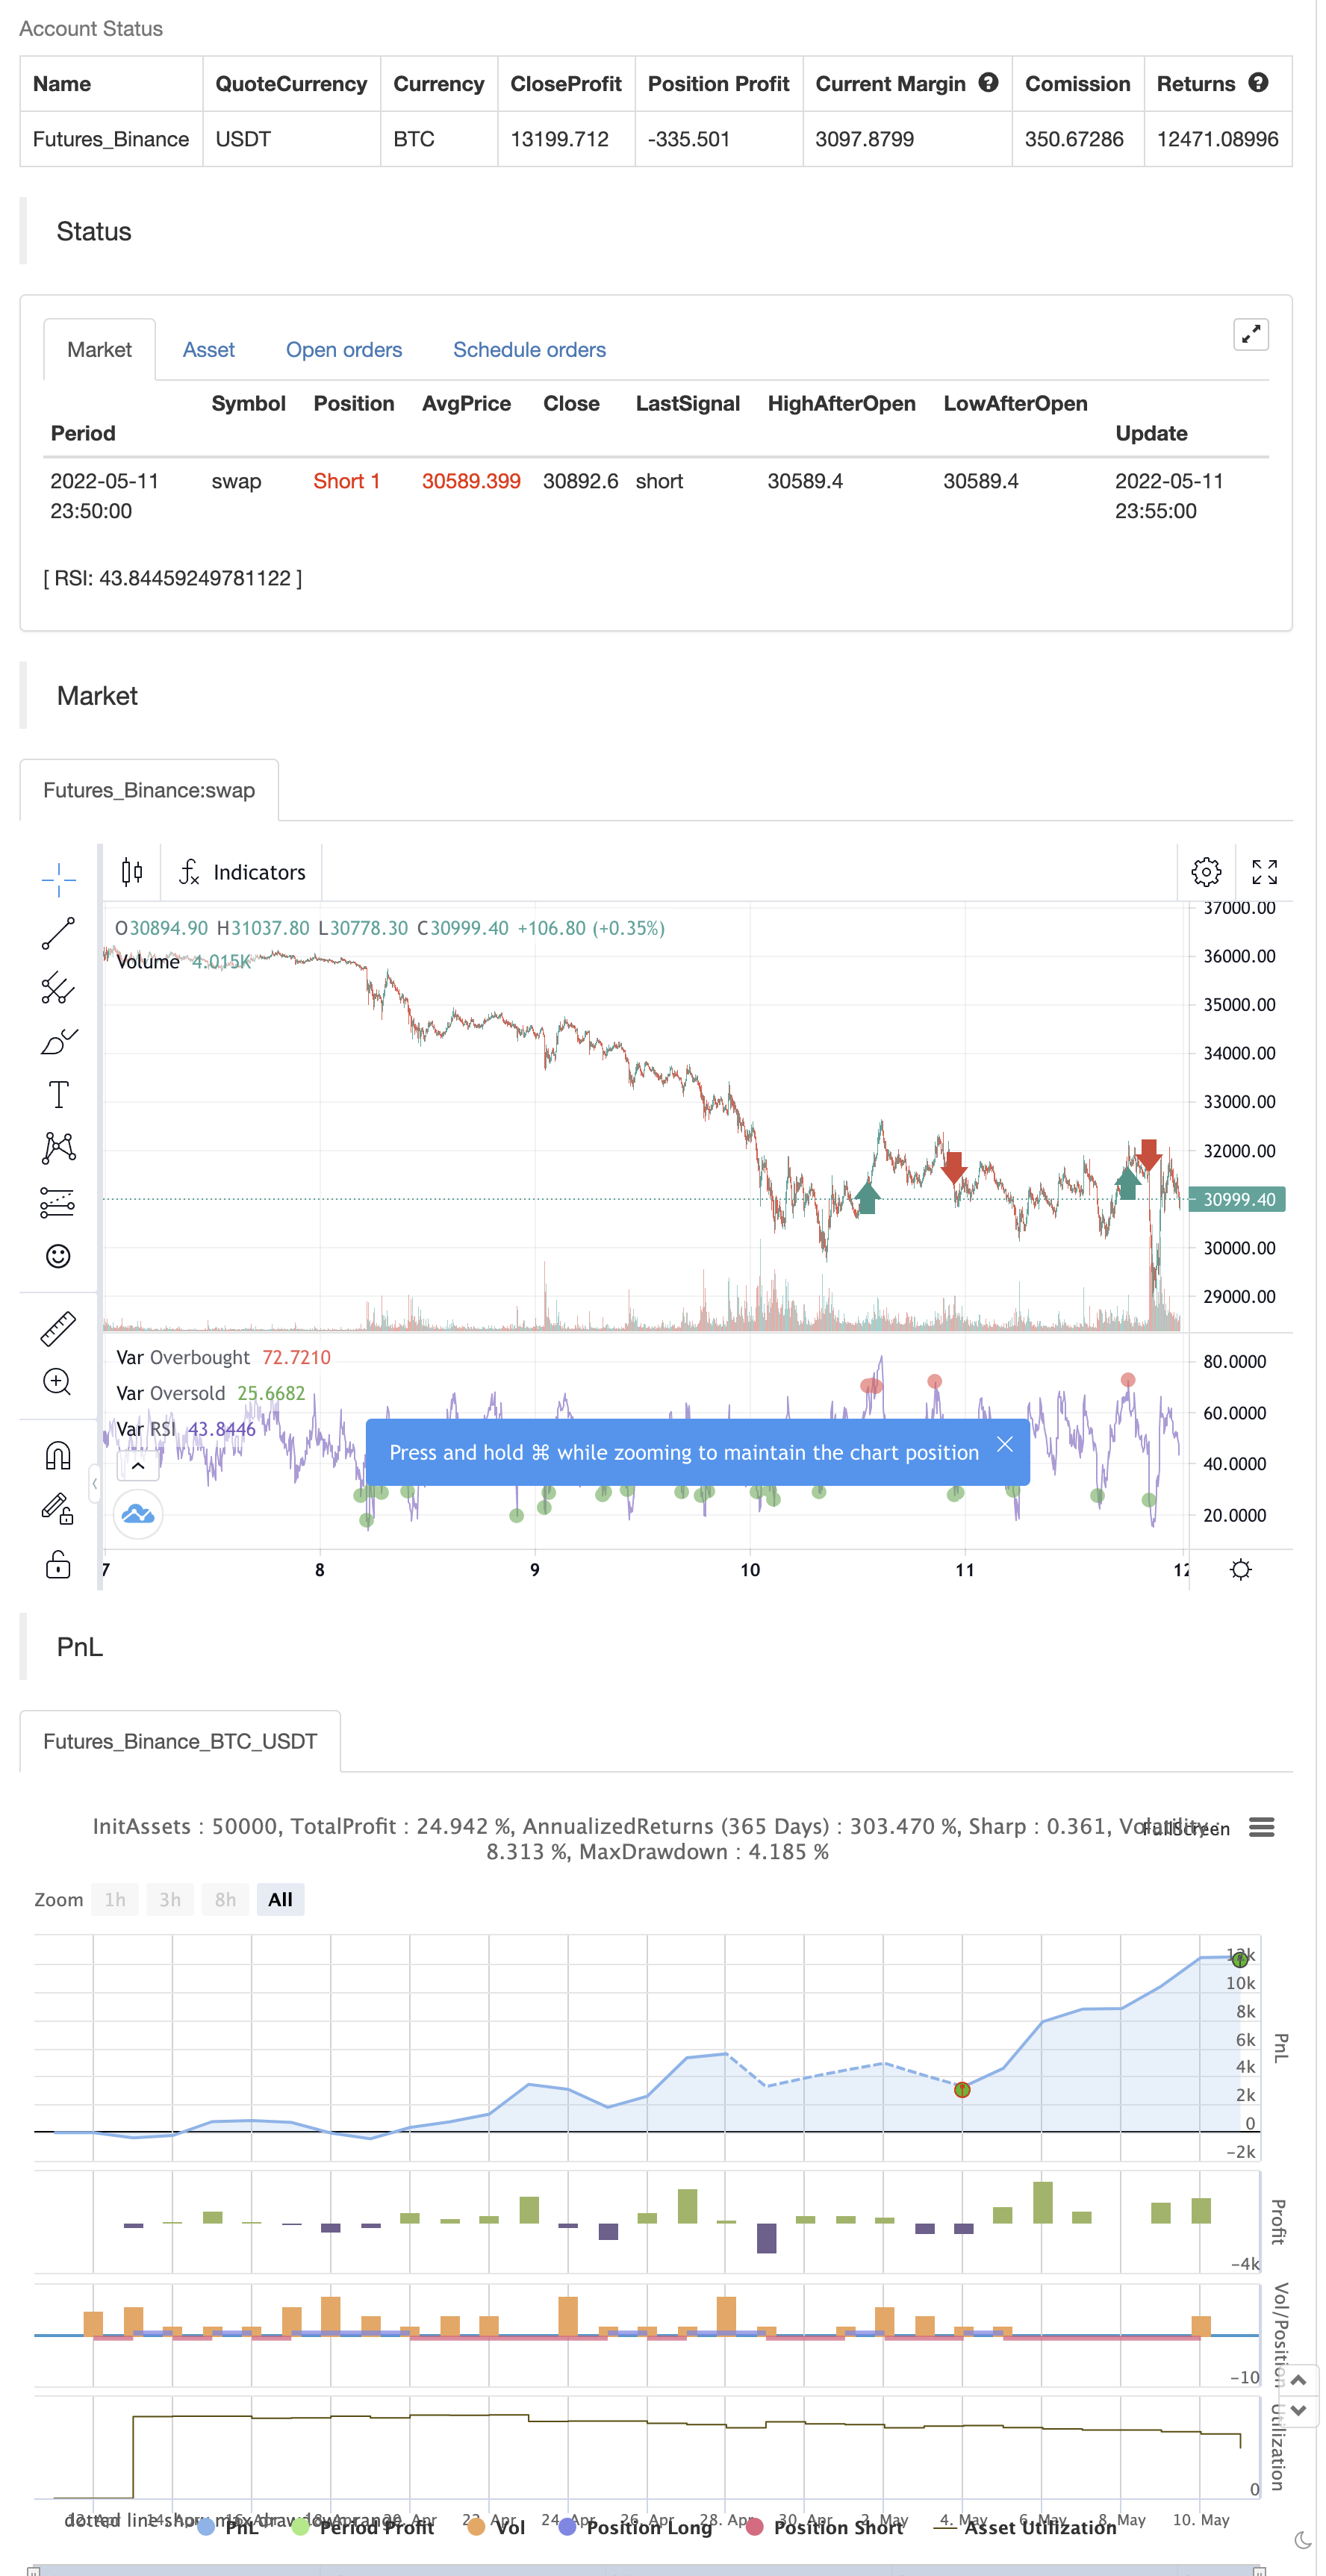
آر ایس آئی کی روایتی تشریحات اور استعمال کا مطلب یہ ہے کہ 70 یا اس سے زیادہ کی اقدار سے پتہ چلتا ہے کہ سیکیورٹی زیادہ سے زیادہ خریدی گئی ہے یا زیادہ سے زیادہ قدر کی جاتی ہے اور یہ رجحان کی تبدیلی یا اصلاحی قیمت کی واپسی کے لئے تیار ہوسکتی ہے۔ آر ایس آئی کی 30 یا اس سے کم پڑھنے سے زیادہ فروخت یا کم قیمت کی حالت ظاہر ہوتی ہے۔
30 = زیادہ فروخت 70 = زیادہ خریدنا
آپ کی تجویز کے لیے شکریہ @ڈائیگوبل مونٹی۔
بیک ٹسٹ
/*backtest
start: 2022-04-12 00:00:00
end: 2022-05-11 23:59:00
period: 5m
basePeriod: 1m
exchanges: [{"eid":"Futures_Binance","currency":"BTC_USDT"}]
*/

// This source code is subject to the terms of the Mozilla Public License 2.0 at https://mozilla.org/MPL/2.0/
// © zdmre

//@version=5
indicator("RSI by zdmre", overlay=false)

len = input.int(14, minval=1, title='Length')
src = input(close, 'Source')
up = ta.rma(math.max(ta.change(src), 0), len)
down = ta.rma(-math.min(ta.change(src), 0), len)
rsi = down == 0 ? 100 : up == 0 ? 0 : 100 - 100 / (1 + up / down)
plot(rsi, 'RSI', color=color.new(#7E57C2, 0))
band1 = hline(70, "Upper Band", color=#787B86)
bandm = hline(50, "Middle Band", color=color.new(#787B86, 50))
band0 = hline(30, "Lower Band", color=#787B86)
fill(band1, band0, color=color.rgb(126, 87, 194, 90), title="Background")

ob= ta.cross(rsi, 70) == 1 and rsi >= 70
os = ta.cross(rsi, 30) == 1 and rsi <= 30

plot(ob ? rsi : na ,title='Overbought', style=plot.style_circles, color=color.new(color.red, 0), linewidth=5)
plot(os ? rsi : na ,title='Oversold ', style=plot.style_circles, color=color.new(color.green, 0), linewidth=5)

if ob
    strategy.entry("Enter Long", strategy.long)
else if os
    strategy.entry("Enter Short", strategy.short)
متعلقہ
- فبونیکی رجحان الٹ کرنے کی حکمت عملی
- وی ڈبلیو ایم اے-اے ڈی ایکس مومنٹم اور ٹرینڈ پر مبنی بٹ کوائن لانگ حکمت عملی
- خرید/فروخت کے ساتھ EMA ADX RSI کا اسکیلپنگ
- FTSMA - رجحان آپ کا دوست ہے
- ناقص فتح کی حکمت عملی
- بہترین نگلنگ + بریک آؤٹ حکمت عملی
- سپر اسکیلپر - 5 منٹ 15 منٹ
- سپر جمپ ٹرن بیک بولنگر بینڈ
- فوکوز رجحان
- ایس ایس ایل ہائبرڈ
- رفتار پر مبنی زگ زگ
مزید
- سڈبوس
- پییوٹ پوائنٹس اعلی کم ملٹی ٹائم فریم
- گھوٹالہ رجحانات کی حکمت عملی کا ڈیٹا بیس
- گھوٹالہ رجحانات کی پیروی کرنے کی حکمت عملی
- گھوسٹ ٹرینڈ ٹریکنگ کی حکمت عملی
- رینبو اوسیلیٹر
- ایکویٹی وکر کی پوزیشن سائزنگ مثال کی تجارت
- KLineChart ڈیمو
- وِلا ڈائنامک پِیوٹ سپر ٹرینڈ حکمت عملی
- کروڈل کا سپر ٹرینڈ
- FTL - رینج فلٹر X2 + EMA + UO
- برہماسترا
- موبو بینڈ
- SAR + 3SMMA SL & TP کے ساتھ
- ایس ایس ایس
- چاند لانچ الرٹس ٹیمپلیٹ [شاندار]
- HALFTREND + HEMA + SMA (غلط سگنل کی حکمت عملی)
- RSI Pivot، BB، SMA، EMA، SMMA، WMA، VWMA کے ساتھ اختلاف
- آر ایس آئی اور بی بی اور بیک وقت اوور سیلڈ
- رولنگ ہائکن آشی موم بتیاں