تصور دوہری سپر ٹرینڈ
مصنف:چاؤ ژانگ، تاریخ: 2022-05-17 14:40:40ٹیگز:ایس ایم اےاے ٹی آر
سادہ سپر ٹرینڈ اشارے آپ کو ایک ہی اسکرپٹ پر دو سپر ٹرینڈس کو ظاہر کرنے کے علاوہ اضافی حسب ضرورت خصوصیات کا اختیار فراہم کرتا ہے۔ انکم شارکس سے متاثر ڈبل سیٹ اپ
بیک ٹسٹ
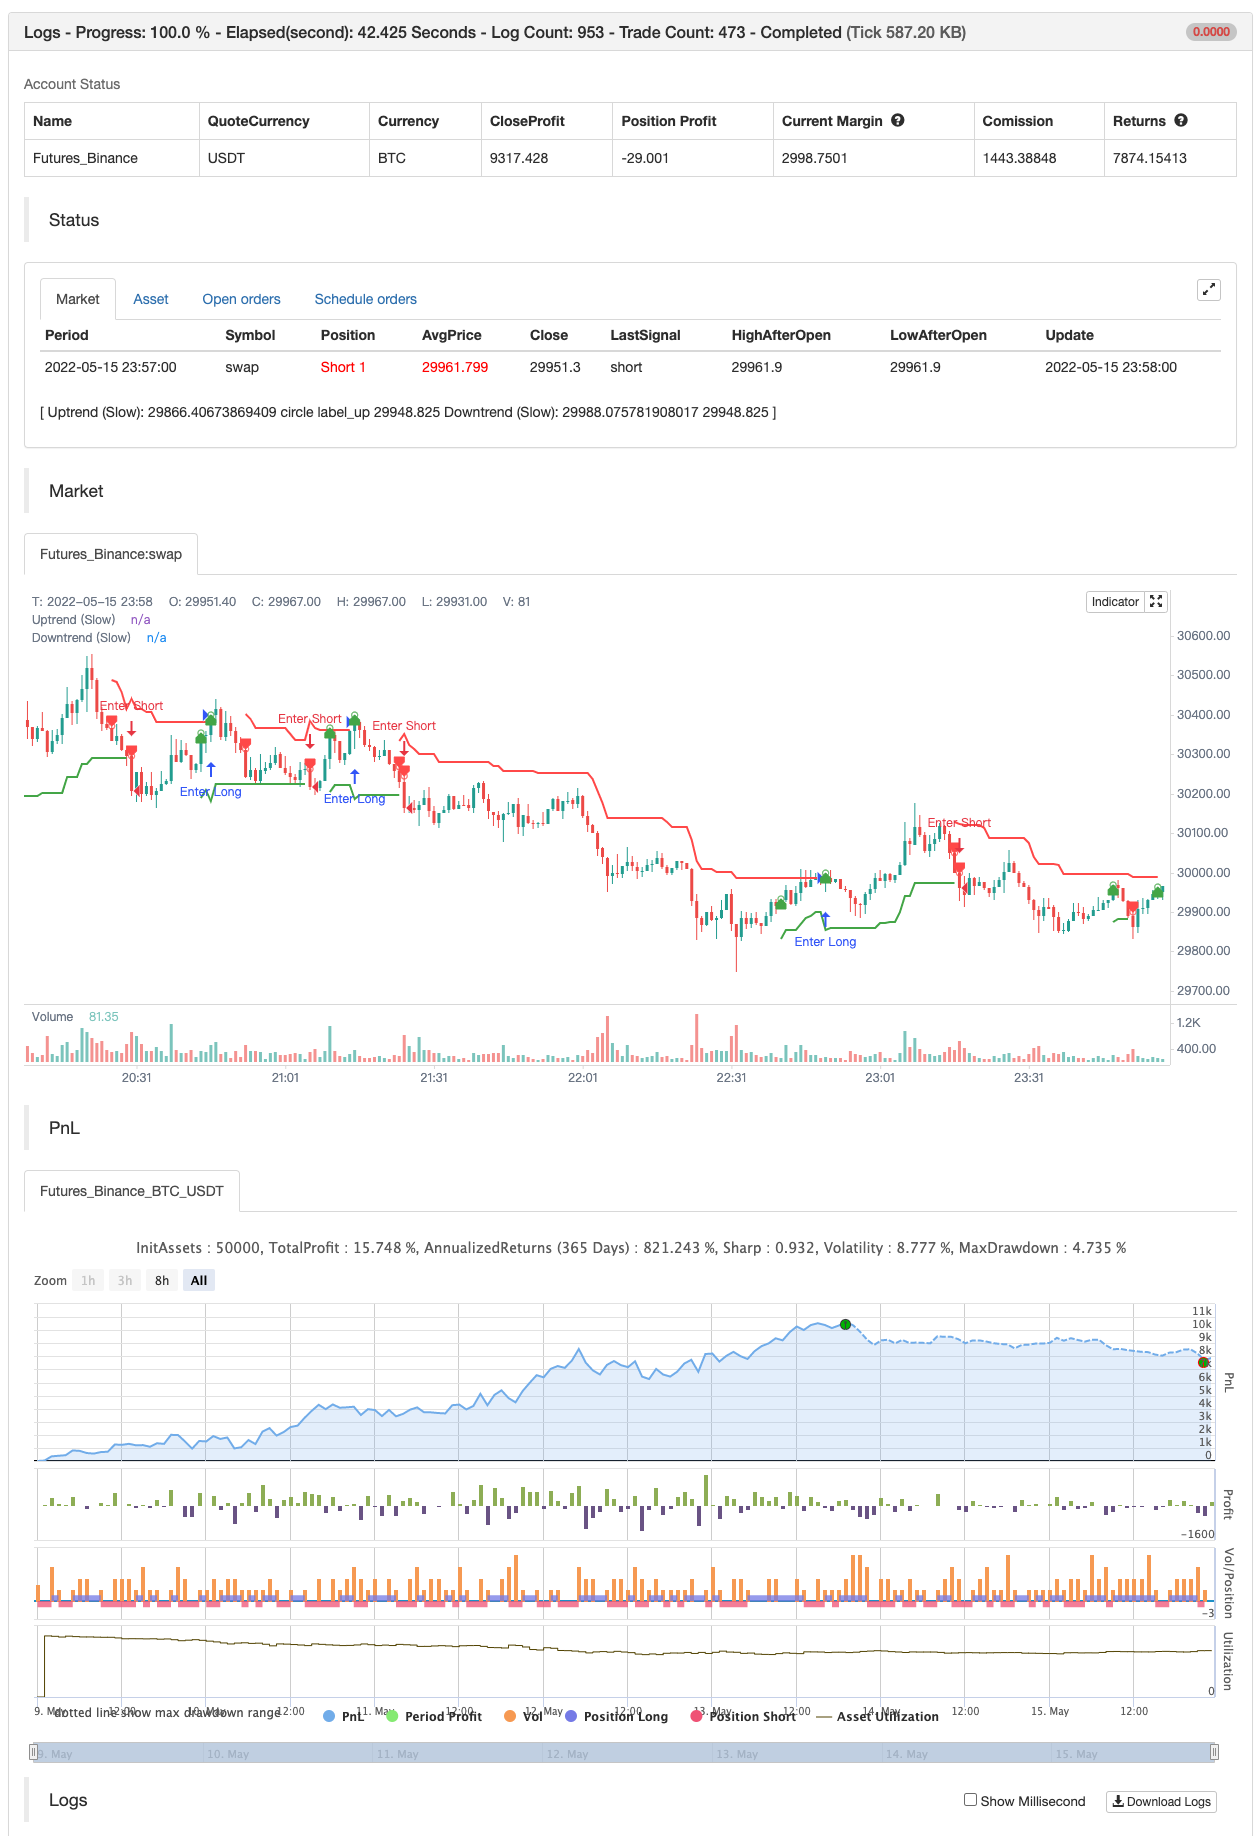
/*backtest
start: 2022-05-09 00:00:00
end: 2022-05-15 23:59:00
period: 1m
basePeriod: 1m
exchanges: [{"eid":"Futures_Binance","currency":"BTC_USDT"}]
*/

//@version=5
indicator(title='Concept Dual SuperTrend', shorttitle='ConceptDST', overlay=true, format=format.price, precision=2, timeframe='')

src = input(hl2, title='Source')
multiplier = input.float(title='ATR Multiplier (Fast)', step=0.1, defval=2)
multiplier2 = input.float(title='ATR Multiplier (Slow)', step=0.1, defval=3)
periods = input(title='ATR Period (Fast)', defval=10)
periods2 = input(title='ATR Period (Slow)', defval=10)
transp_st = input.float(title='Line Transparency', step=1, minval=0, maxval=100, defval=70)
transp_hl = input.float(title='Shading Transparency', step=1, minval=0, maxval=100, defval=90)
changeATR = input(title='Change ATR Calculation Method?', defval=true)
highlighting = input(title='Show Shading? (Fast)', defval=true)
highlighting2 = input(title='Show Shading? (Slow)', defval=true)
showlabels = input(title='Show Buy/Sell Labels?', defval=true)


//------------------------------------------------

// Calculations (Fast)
atrA = ta.sma(ta.tr, periods)
atr = changeATR ? ta.atr(periods) : atrA
up = src - multiplier * atr
upA = nz(up[1], up)
up := close[1] > upA ? math.max(up, upA) : up
dn = src + multiplier * atr
dnA = nz(dn[1], dn)
dn := close[1] < dnA ? math.min(dn, dnA) : dn

// Trend (Fast)
trend = 1
trend := nz(trend[1], trend)
trend := trend == -1 and close > dnA ? 1 : trend == 1 and close < upA ? -1 : trend

upPlot = plot(trend == 1 ? up : na, title='Uptrend (Slow)', style=plot.style_linebr, linewidth=2, color=color.new(color.green, transp_st))
buySignal = trend == 1 and trend[1] == -1
plotshape(buySignal ? up : na, title='Uptrend Start (Slow)', location=location.absolute, style=shape.circle, size=size.tiny, color=color.new(color.green, transp_st))
plotshape(buySignal and showlabels ? up : na, title='Buy', text='Buy', location=location.absolute, style=shape.labelup, size=size.tiny, color=color.new(color.green, 0), textcolor=color.new(color.white, 0))

dnPlot = plot(trend == 1 ? na : dn, title='Downtrend (Slow)', style=plot.style_linebr, linewidth=2, color=color.new(color.red, transp_st))
sellSignal = trend == -1 and trend[1] == 1
plotshape(sellSignal ? dn : na, title='Downtrend Start (Slow)', location=location.absolute, style=shape.circle, size=size.tiny, color=color.new(color.red, transp_st))
plotshape(sellSignal and showlabels ? dn : na, title='Sell', text='Sell', location=location.absolute, style=shape.labeldown, size=size.tiny, color=color.new(color.red, 0), textcolor=color.new(color.white, 0))

mPlot = plot(ohlc4, title='', style=plot.style_circles, linewidth=0, color=na)
longFillColor = highlighting ? trend == 1 ? color.green : color.black : color.black
shortFillColor = highlighting ? trend == -1 ? color.red : color.black : color.black
fill(mPlot, upPlot, title='Uptrend Shading (Slow)', color=color.new(longFillColor, transp_hl))
fill(mPlot, dnPlot, title='Downtrend Shading (Slow)', color=color.new(shortFillColor, transp_hl))

//------------------------------------------------

// Calculations (Slow)
atrA2 = ta.sma(ta.tr, periods2)
atr2 = changeATR ? ta.atr(periods2) : atrA2
up2 = src - multiplier2 * atr2
upA2 = nz(up2[1], up2)
up2 := close[1] > upA2 ? math.max(up2, upA2) : up2
dn2 = src + multiplier2 * atr2
dnA2 = nz(dn2[1], dn2)
dn2 := close[1] < dnA2 ? math.min(dn2, dnA2) : dn2

// Trend (Slow)
trend2 = 1
trend2 := nz(trend2[1], trend2)
trend2 := trend2 == -1 and close > dnA2 ? 1 : trend2 == 1 and close < upA2 ? -1 : trend2

upPlot2 = plot(trend2 == 1 ? up2 : na, title='Uptrend (Slow)', style=plot.style_linebr, linewidth=2, color=color.new(color.green, transp_st))
buySignal2 = trend2 == 1 and trend2[1] == -1
plotshape(buySignal2 ? up2 : na, title='Uptrend Start (Slow)', location=location.absolute, style=shape.circle, size=size.tiny, color=color.new(color.green, transp_st))
plotshape(buySignal2 and showlabels ? up2 : na, title='Buy', text='Buy', location=location.absolute, style=shape.labelup, size=size.tiny, color=color.new(color.green, 0), textcolor=color.new(color.white, 0))

dnPlot2 = plot(trend2 == 1 ? na : dn2, title='Downtrend (Slow)', style=plot.style_linebr, linewidth=2, color=color.new(color.red, transp_st))
sellSignal2 = trend2 == -1 and trend2[1] == 1
plotshape(sellSignal2 ? dn2 : na, title='Downtrend Start (Slow)', location=location.absolute, style=shape.circle, size=size.tiny, color=color.new(color.red, transp_st))
plotshape(sellSignal2 and showlabels ? dn2 : na, title='Sell', text='Sell', location=location.absolute, style=shape.labeldown, size=size.tiny, color=color.new(color.red, 0), textcolor=color.new(color.white, 0))

mPlot2 = plot(ohlc4, title='', style=plot.style_circles, linewidth=0, color=na)
longFillColor2 = highlighting2 ? trend2 == 1 ? color.green : color.black : color.black
shortFillColor2 = highlighting2 ? trend2 == -1 ? color.red : color.black : color.black
fill(mPlot2, upPlot2, title='Uptrend Shading (Slow)', color=color.new(longFillColor2, transp_hl))
fill(mPlot2, dnPlot2, title='Downtrend Shading (Slow)', color=color.new(shortFillColor2, transp_hl))


if buySignal2
    strategy.entry("Enter Long", strategy.long)
else if sellSignal2
    strategy.entry("Enter Short", strategy.short)
متعلقہ
- دن کے اندر قابل پیمانے پر اتار چڑھاؤ ٹریڈنگ کی حکمت عملی
- الفا ٹرینڈ
- سپر ٹرینڈ+4متحرک
- لائن اشارے پر عمل کریں
- ایم ایل انتباہات کا نمونہ
- اپنے رجحان کو حاصل کریں
- ایس ایم اے بی ٹی سی قاتل
- ویگاس سپر ٹرینڈ بہتر حکمت عملی
- ایس ایس ایل ہائبرڈ
- وِلا ڈائنامک پِیوٹ سپر ٹرینڈ حکمت عملی
مزید
- فوکوز رجحان
- جانی کی BOT
- ایس ایس ایل ہائبرڈ
- لوڈشیلڈر باہر نکلیں
- ریسوٹو
- ای ایم اے کلاؤڈ انٹرا ڈے حکمت عملی
- پییوٹ پوائنٹ سپر ٹرینڈ
- سپر ٹرینڈ+4متحرک
- رفتار پر مبنی زگ زگ
- VuManChu Cipher B + Divergences حکمت عملی
- سپر اسکیلپر
- بیک ٹسٹنگ- اشارے
- ٹرینڈیلیوس
- ایس ایم اے بی ٹی سی قاتل
- ایم ایل انتباہات کا نمونہ
- وقفے کے ساتھ فبونیکی ترقی
- RSI MTF Ob+Os
- Fukuiz Octa-EMA + Ichimoku
- سی سی آئی ایم ٹی ایف او بی + او
- زیادہ ذہین MACD