RSI của zdmre
Tác giả:ChaoZhang, Ngày: 2022-05-13 16:34:43Tags:RMA
Các giải thích và sử dụng truyền thống của chỉ số RSI chỉ ra rằng giá trị 70 hoặc cao hơn cho thấy một chứng khoán trở nên quá mua hoặc quá định giá và có thể được chuẩn bị cho một sự đảo ngược xu hướng hoặc giảm giá điều chỉnh.
30 = bán quá mức 70 = Mua quá mức
Cảm ơn @DieGobelMonte vì đề xuất của bạn.
backtest
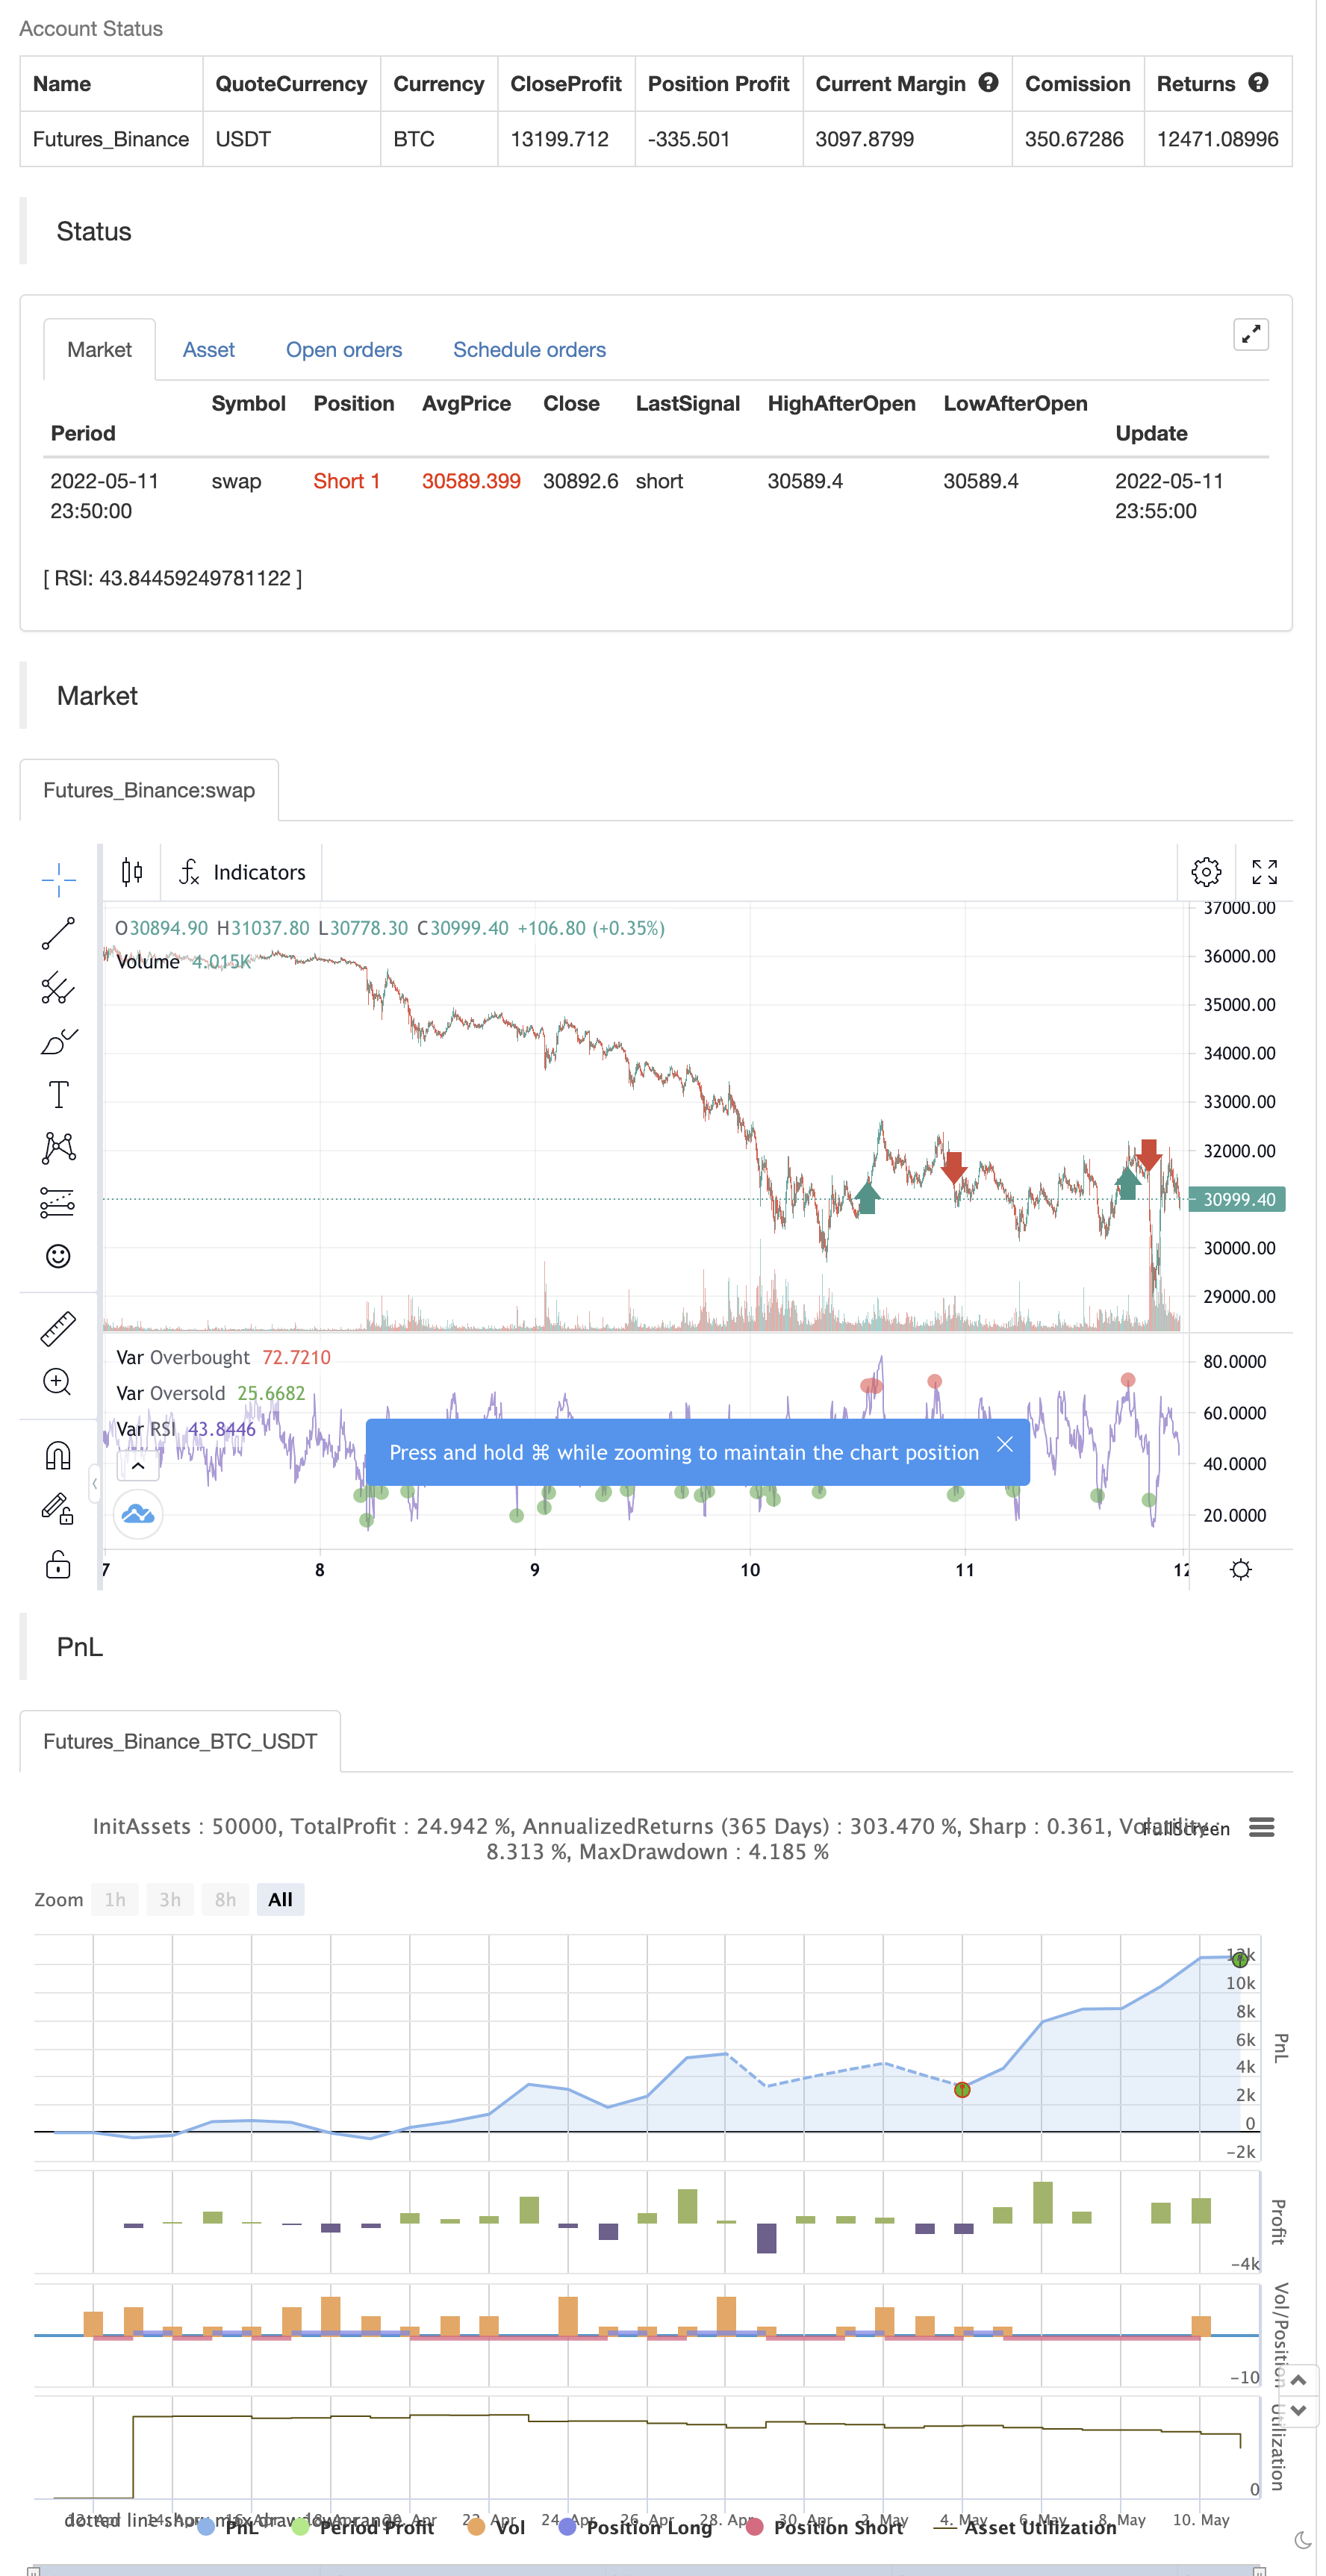
/*backtest
start: 2022-04-12 00:00:00
end: 2022-05-11 23:59:00
period: 5m
basePeriod: 1m
exchanges: [{"eid":"Futures_Binance","currency":"BTC_USDT"}]
*/

// This source code is subject to the terms of the Mozilla Public License 2.0 at https://mozilla.org/MPL/2.0/
// © zdmre

//@version=5
indicator("RSI by zdmre", overlay=false)

len = input.int(14, minval=1, title='Length')
src = input(close, 'Source')
up = ta.rma(math.max(ta.change(src), 0), len)
down = ta.rma(-math.min(ta.change(src), 0), len)
rsi = down == 0 ? 100 : up == 0 ? 0 : 100 - 100 / (1 + up / down)
plot(rsi, 'RSI', color=color.new(#7E57C2, 0))
band1 = hline(70, "Upper Band", color=#787B86)
bandm = hline(50, "Middle Band", color=color.new(#787B86, 50))
band0 = hline(30, "Lower Band", color=#787B86)
fill(band1, band0, color=color.rgb(126, 87, 194, 90), title="Background")

ob= ta.cross(rsi, 70) == 1 and rsi >= 70
os = ta.cross(rsi, 30) == 1 and rsi <= 30

plot(ob ? rsi : na ,title='Overbought', style=plot.style_circles, color=color.new(color.red, 0), linewidth=5)
plot(os ? rsi : na ,title='Oversold ', style=plot.style_circles, color=color.new(color.green, 0), linewidth=5)

if ob
    strategy.entry("Enter Long", strategy.long)
else if os
    strategy.entry("Enter Short", strategy.short)
Có liên quan
- Chiến lược đảo ngược xu hướng Fibonacci
- VWMA-ADX Momentum và Chiến lược dài Bitcoin dựa trên xu hướng
- Scalping EMA ADX RSI với Buy/Sell
- FTSMA - Trend là bạn của bạn
- Chiến lược chiến thắng hoàn hảo
- Chiến lược ngập + thoát tốt nhất
- Super Scalper - 5 phút 15 phút
- SuperJump quay lại Bollinger Band
- Xu hướng Fukuiz
- SSL lai
- ZigZag dựa trên động lượng
Thêm nữa
- Sidboss
- Điểm trục cao thấp nhiều khung thời gian
- Phantom Trends theo dõi cơ sở dữ liệu chiến lược
- Phantom Trends theo dõi các cơ sở kinh doanh chiến lược
- Chiến lược theo dõi xu hướng ma
- Rainbow Oscillator
- Thương mại đường cong vốn chủ sở hữu ví dụ về kích thước vị trí
- KLineChart Demo
- Chiến lược siêu xu hướng Villa Dynamic Pivot
- Crodl's Supertrend
- FTL - Range Filter X2 + EMA + UO
- BRAHMASTRA
- Nhóm nhạc Mobo
- SAR + 3SMMA với SL & TP
- SSS
- Mô hình cảnh báo phóng mặt trăng [Dấu hiệu]
- HALFTREND + HEMA + SMA (Chiến lược tín hiệu sai)
- RSI Divergence với Pivot, BB, SMA, EMA, SMMA, WMA, VWMA
- RSI và BB và đồng thời OverSold
- Quay nến Heikin Ashi