Tối đa hóa lợi nhuận PMax
Tác giả:ChaoZhang, Ngày: 2022-05-25 17:13:45Tags:SMAEMAWMATMAATRZLEMA
Cả MOST và SuperTrend Indicators đều rất giỏi trong các hệ thống theo xu hướng nhưng ngược lại, hiệu suất của chúng không sáng trong điều kiện thị trường bên cạnh như hầu hết các chỉ số khác.
Tối đa hóa lợi nhuận - PMax cố gắng giải quyết vấn đề này. PMax kết hợp các mặt mạnh mẽ của MOST (Moving Average Trend Changer) và SuperTrend (ATR price detection) trong một chỉ số.
Kết quả kiểm tra và tối ưu hóa của PMax tốt hơn nhiều so với các tổ tiên của nó MOST và SuperTrend. Nó làm giảm số lượng tín hiệu sai bên và cung cấp tín hiệu giao dịch đáng tin cậy hơn.
PMax dễ dàng xác định xu hướng và có thể được sử dụng trong bất kỳ loại thị trường và công cụ nào.
Parameter đầu tiên trong chỉ số PMax được thiết lập bởi ba tham số là khoảng thời gian / thời gian của ATR.
Các thông số thứ hai là nhân của ATR mà sẽ hữu ích để thiết lập giá trị của khoảng cách từ xây dựng trong Moving Average.
Cá nhân tôi nghĩ rằng các thông số quan trọng nhất là Moving Average Length và type.
PMax sẽ nhạy cảm với xu hướng nếu Moving Average Length nhỏ hơn và ngược lại, sẽ ít nhạy cảm hơn khi dài hơn.
Khi thời gian kéo dài nó sẽ trở nên ít nhạy cảm hơn với xu hướng nhỏ và hành động giá.
Bằng cách này, sự lựa chọn của bạn về thời gian, sẽ liên quan chặt chẽ đến loại xu hướng nào bạn quan tâm.
Chúng tôi đang chịu ảnh hưởng của xu hướng tăng trong trường hợp mà trung bình di chuyển là trên PMax; ngược lại dưới ảnh hưởng của xu hướng giảm, khi Đường trung bình động dưới PMax.
Được xây dựng trong loại Moving Average được đặt mặc định là EMA nhưng người dùng có thể chọn từ 8 loại Moving Average khác nhau như:
SMA: Mức trung bình di chuyển đơn giản EMA: Trung bình chuyển động theo cấp số nhân WMA: Trung bình di chuyển cân nhắc TMA: Trung bình di chuyển tam giác VAR: Chỉ số biến động Đường trung bình động còn gọi là VIDYA WWMA: Welles Wilder's Moving Average ZLEMA: Trung bình di chuyển theo hàm số không trễ TSF: Sức mạnh thực sự
Mẹo: VAR bên cạnh sẽ là một lựa chọn tốt
Bạn có thể sử dụng báo động mặc định PMax và tín hiệu Mua bán như:
1- Mua khi Moving Average vượt trên PMax Bán khi Moving Average vượt dưới PMax
2- Mua khi giá nhảy qua đường Pmax. Bán khi giá xuống dưới đường Pmax.
backtest
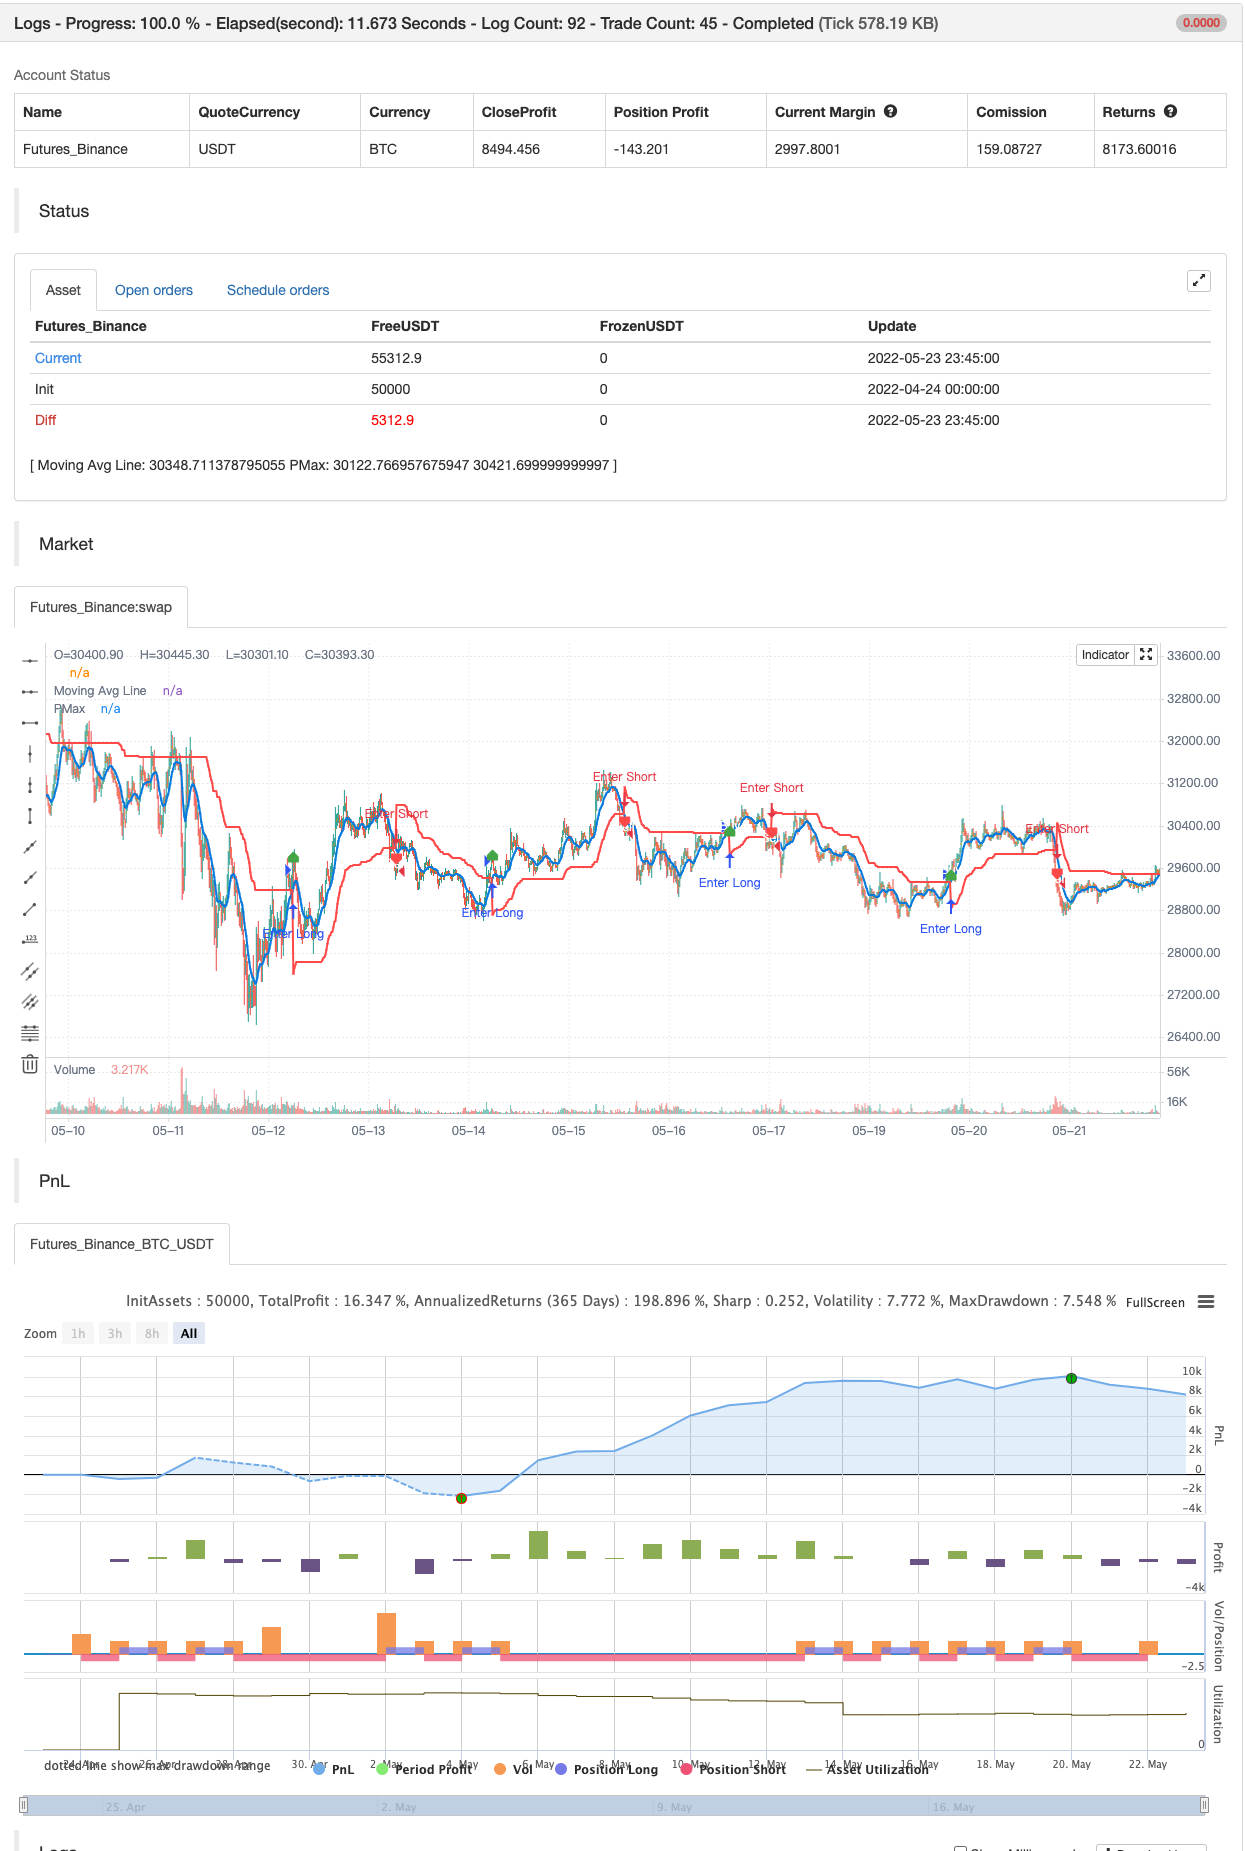
/*backtest
start: 2022-04-24 00:00:00
end: 2022-05-23 23:59:00
period: 15m
basePeriod: 5m
exchanges: [{"eid":"Futures_Binance","currency":"BTC_USDT"}]
*/

//@version=4
// This source code is subject to the terms of the Mozilla Public License 2.0 at https://mozilla.org/MPL/2.0/
// © KivancOzbilgic
//developer: @KivancOzbilgic
//author: @KivancOzbilgic

study("Profit Maximizer","PMax", overlay=true, format=format.price, precision=2, resolution="")
src = input(hl2, title="Source")
Periods = input(title="ATR Length", type=input.integer, defval=10)
Multiplier = input(title="ATR Multiplier", type=input.float, step=0.1, defval=3.0)
mav = input(title="Moving Average Type", defval="EMA", options=["SMA", "EMA", "WMA", "TMA", "VAR", "WWMA", "ZLEMA", "TSF"])
length =input(10, "Moving Average Length", minval=1)
changeATR= input(title="Change ATR Calculation Method ?", type=input.bool, defval=true)
Normalize= input(title="Normalize ATR ?", type=input.bool, defval=false)
showsupport = input(title="Show Moving Average?", type=input.bool, defval=true)
showsignalsk = input(title="Show Crossing Signals?", type=input.bool, defval=true)
showsignalsc = input(title="Show Price/Pmax Crossing Signals?", type=input.bool, defval=false)
highlighting = input(title="Highlighter On/Off ?", type=input.bool, defval=true)
atr2 = sma(tr, Periods)
atr= changeATR ? atr(Periods) : atr2
valpha=2/(length+1)
vud1=src>src[1] ? src-src[1] : 0
vdd1=src<src[1] ? src[1]-src : 0
vUD=sum(vud1,9)
vDD=sum(vdd1,9)
vCMO=nz((vUD-vDD)/(vUD+vDD))
VAR=0.0
VAR:=nz(valpha*abs(vCMO)*src)+(1-valpha*abs(vCMO))*nz(VAR[1])
wwalpha = 1/ length
WWMA = 0.0
WWMA := wwalpha*src + (1-wwalpha)*nz(WWMA[1])
zxLag = length/2==round(length/2) ? length/2 : (length - 1) / 2
zxEMAData = (src + (src - src[zxLag]))
ZLEMA = ema(zxEMAData, length)
lrc = linreg(src, length, 0)
lrc1 = linreg(src,length,1)
lrs = (lrc-lrc1)
TSF = linreg(src, length, 0)+lrs
getMA(src, length) =>
    ma = 0.0
    if mav == "SMA"
        ma := sma(src, length)
        ma

    if mav == "EMA"
        ma := ema(src, length)
        ma

    if mav == "WMA"
        ma := wma(src, length)
        ma

    if mav == "TMA"
        ma := sma(sma(src, ceil(length / 2)), floor(length / 2) + 1)
        ma

    if mav == "VAR"
        ma := VAR
        ma

    if mav == "WWMA"
        ma := WWMA
        ma

    if mav == "ZLEMA"
        ma := ZLEMA
        ma

    if mav == "TSF"
        ma := TSF
        ma
    ma

MAvg=getMA(src, length)
longStop = Normalize ? MAvg - Multiplier*atr/close : MAvg - Multiplier*atr
longStopPrev = nz(longStop[1], longStop)
longStop := MAvg > longStopPrev ? max(longStop, longStopPrev) : longStop
shortStop = Normalize ? MAvg + Multiplier*atr/close : MAvg + Multiplier*atr
shortStopPrev = nz(shortStop[1], shortStop)
shortStop := MAvg < shortStopPrev ? min(shortStop, shortStopPrev) : shortStop
dir = 1
dir := nz(dir[1], dir)
dir := dir == -1 and MAvg > shortStopPrev ? 1 : dir == 1 and MAvg < longStopPrev ? -1 : dir
PMax = dir==1 ? longStop: shortStop
plot(showsupport ? MAvg : na, color=#0585E1, linewidth=2, title="Moving Avg Line")
pALL=plot(PMax, color=color.red, linewidth=2, title="PMax", transp=0)
alertcondition(cross(MAvg, PMax), title="Cross Alert", message="PMax - Moving Avg Crossing!")
alertcondition(crossover(MAvg, PMax), title="Crossover Alarm", message="Moving Avg BUY SIGNAL!")
alertcondition(crossunder(MAvg, PMax), title="Crossunder Alarm", message="Moving Avg SELL SIGNAL!")
alertcondition(cross(src, PMax), title="Price Cross Alert", message="PMax - Price Crossing!")
alertcondition(crossover(src, PMax), title="Price Crossover Alarm", message="PRICE OVER PMax - BUY SIGNAL!")
alertcondition(crossunder(src, PMax), title="Price Crossunder Alarm", message="PRICE UNDER PMax - SELL SIGNAL!")

buySignalk = crossover(MAvg, PMax)
plotshape(buySignalk and showsignalsk ? PMax*0.995 : na, title="Buy", text="Buy", location=location.absolute, style=shape.labelup, size=size.tiny, color=color.green, textcolor=color.white, transp=0)

sellSignallk = crossunder(MAvg, PMax)
plotshape(sellSignallk and showsignalsk ? PMax*1.005 : na, title="Sell", text="Sell", location=location.absolute, style=shape.labeldown, size=size.tiny, color=color.red, textcolor=color.white, transp=0)

buySignalc = crossover(src, PMax)
plotshape(buySignalc and showsignalsc ? PMax*0.995 : na, title="Buy", text="Buy", location=location.absolute, style=shape.labelup, size=size.tiny, color=#0F18BF, textcolor=color.white, transp=0)

sellSignallc = crossunder(src, PMax)
plotshape(sellSignallc and showsignalsc ? PMax*1.005 : na, title="Sell", text="Sell", location=location.absolute, style=shape.labeldown, size=size.tiny, color=#0F18BF, textcolor=color.white, transp=0)

mPlot = plot(ohlc4, title="", style=plot.style_circles, linewidth=0,display=display.none)
longFillColor = highlighting ? (MAvg>PMax ? color.green : na) : na
shortFillColor = highlighting ? (MAvg<PMax ? color.red : na) : na

fill(mPlot, pALL, title="UpTrend Highligter", color=longFillColor)
fill(mPlot, pALL, title="DownTrend Highligter", color=shortFillColor)


if buySignalk
    strategy.entry("Enter Long", strategy.long)
else if sellSignallk
    strategy.entry("Enter Short", strategy.short)
- Đường trung bình di chuyển siêu xu hướng
- SuperJump quay lại Bollinger Band
- Super Scalper
- ESSMA
- Super Scalper - 5 phút 15 phút
- Mẫu cảnh báo ML
- Chiến lược giao dịch định lượng dựa trên đường trung bình động và băng Bollinger
- HALFTREND + HEMA + SMA (Chiến lược tín hiệu sai)
- RedK Dual VADER với thanh năng lượng
- Cảnh báo chéo trung bình chuyển động, nhiều khung thời gian (MTF)
- FTSMA - Trend là bạn của bạn
- Range Filter Mua và bán
- Kênh SSL
- Chiến lược Hull Suite
- SAR Parabolic Mua và bán
- Tiêu chí tối đa và tối thiểu dựa trên pivot
- Nick Rypock Lái ngược (NRTR)
- ZigZag PA Chiến lược V4.1
- Mua/Bán trong ngày
- Phân đoạn bị phá vỡ: giấc mơ bị phá vỡ của ai đó là lợi nhuận của bạn!
- Chiến lược chiến thắng hoàn hảo
- Stochastic + RSI, Chiến lược đôi
- Chiến lược Swing Hull/rsi/EMA
- Scalping Swing Trading Tool R1-4
- Chiến lược ngập + thoát tốt nhất
- Bollinger Awesome Alert R1
- Plugin đồng bộ đa sàn giao dịch
- Triangle Leverage (Lợi nhuận từ giá giao dịch của các đồng tiền nhỏ)
- bybit Reverse Contract Dynamic Grid (Mạng lưới đặc biệt)
- TradingView Alerts cho MT4 MT5 + biến động động