
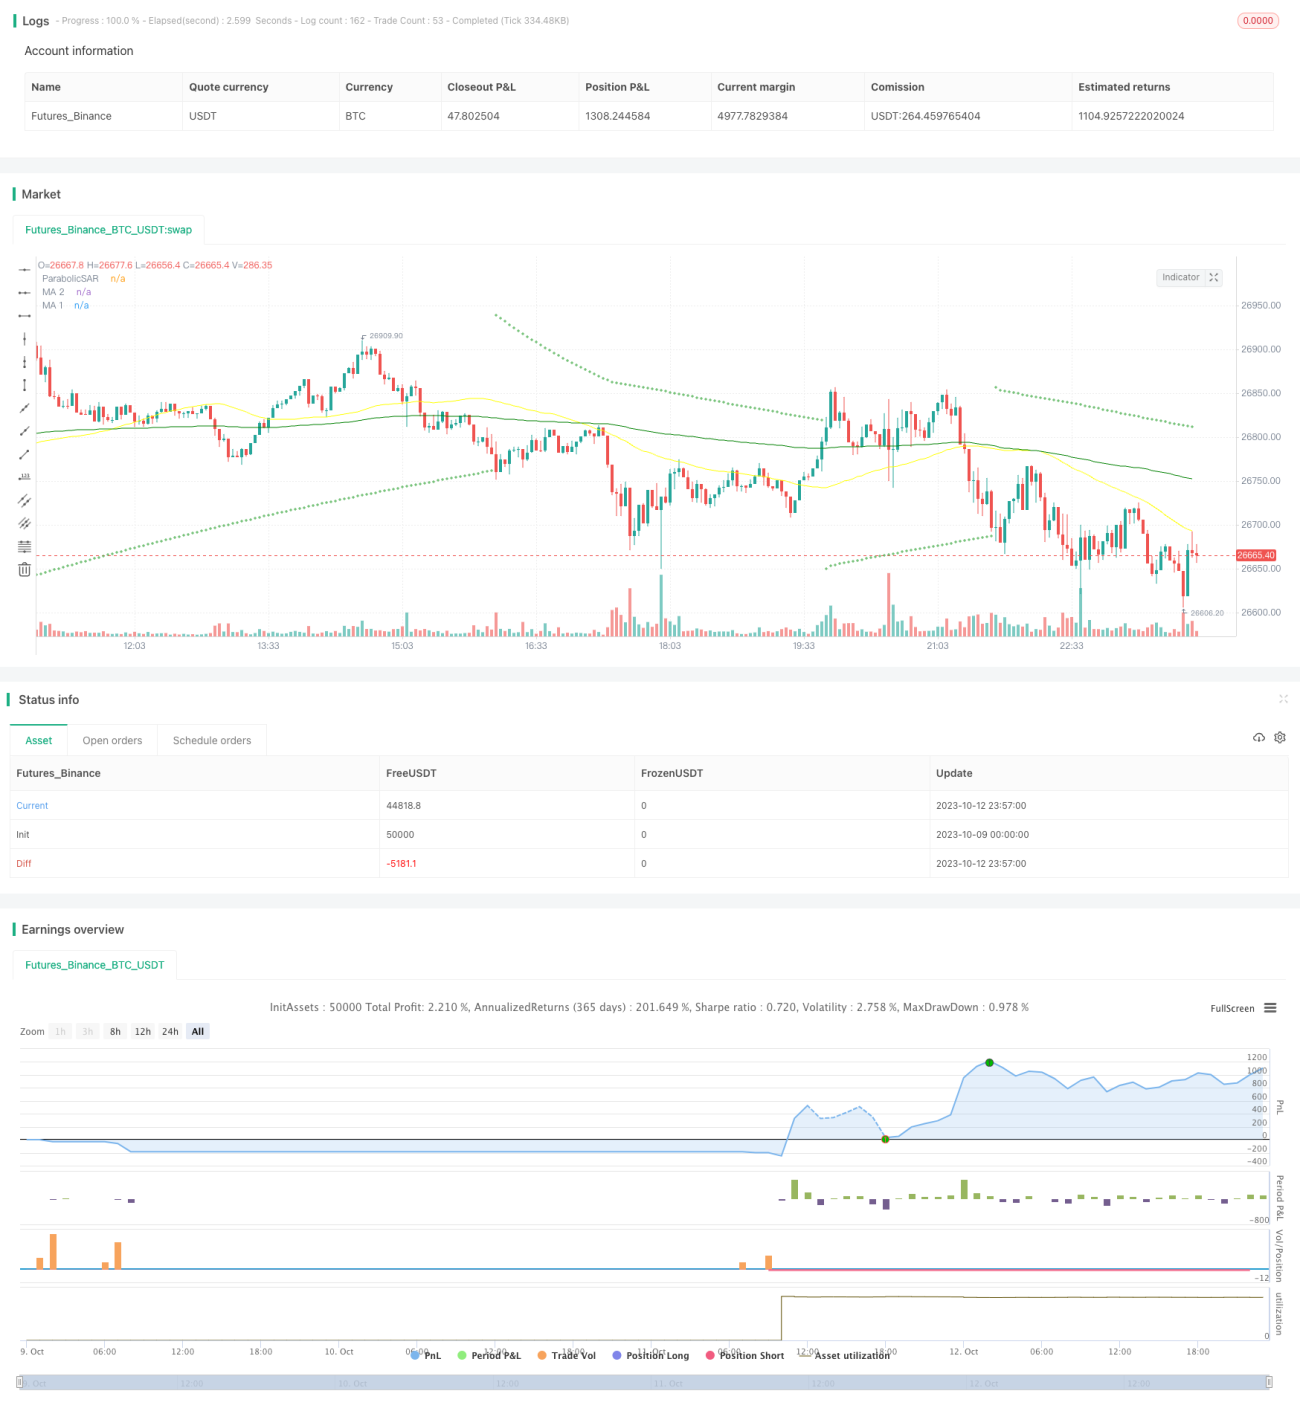
Chiến lược này sử dụng tổng hợp các chỉ số sar, rsi, vol và đường trung bình ma bốn yếu tố để xác định xu hướng, sử dụng các biện pháp quản lý rủi ro vững chắc để theo dõi xu hướng và thu lợi nhuận. Chiến lược sử dụng chỉ số sar làm chủ đề, hỗ trợ rsi để nhận ra tín hiệu đảo ngược, chỉ số vol được xác định là đặc điểm giao dịch, đường trung bình ma để xác định hướng xu hướng chủ đạo. Bằng cách kết hợp nhiều chỉ số để xác định các tín hiệu có thể lọc, xác định hướng xu hướng thực sự.
Chiến lược này sử dụng 4 chỉ số kỹ thuật chính:
Parabolic SAR: Chỉ số này sử dụng mối quan hệ giữa điểm và xu hướng để xác định hướng xu hướng và điểm đảo ngược. Điểm là giá lên khi giá lên và điểm là giá xuống khi giá xuống. Khi điểm vượt qua giá đại diện cho xu hướng. Chiến lược sử dụng sar làm chỉ số chính để xác định hướng xu hướng.
RSI: chỉ số tương đối mạnh. Chỉ số này đánh giá thị trường quá mua và quá bán trong khoảng từ 0 đến 100. RSI cao hơn 70 là khu vực quá mua, thấp hơn 30 là khu vực quá bán, trở lại khu vực đường trung tâm gần 50.
VOL: Chỉ số khối lượng giao dịch. Chiến lược sử dụng VOL để xác định khối lượng giao dịch tăng cường đặc điểm để xác nhận xu hướng và đánh giá chất lượng tín hiệu đảo ngược.
MA: Đường trung bình di chuyển. Chiến lược sử dụng đường trung bình dài và ngắn để xác định hướng của xu hướng thứ hai. Đi qua đường trung bình dài trên đường trung bình ngắn là tín hiệu xem nhiều, đi qua đường trung bình dài dưới đường trung bình ngắn là tín hiệu xem không.
Quy tắc tạo tín hiệu giao dịch:
Điều kiện đa đầu: Điểm SAR chuyển sang phía dưới đường K và RSI tăng trở lên từ dưới lên vào khu vực đường trung, VOL tăng cường đặc trưng rõ rệt, đường trung bình ngắn đi từ dưới lên qua đường trung bình dài.
Điều kiện không đầu: Điểm SAR chuyển sang phía trên đường K và RSI đi từ trên xuống khu vực đường giữa, đặc điểm VOL được tăng cường rõ rệt, đường trung bình ngắn đi từ trên xuống qua đường trung bình dài.
Chiến lược này cũng đặt ra các quy tắc quản lý rủi ro dừng lỗ. Mục tiêu dừng là 2 lần giá nhập, giá dừng là 0,8 lần giá nhập, hiệu quả khóa lợi nhuận và kiểm soát rủi ro.
Chiến lược này có những ưu điểm sau:
Thiết kế kết hợp đa chỉ số tránh các tín hiệu giả, và thực sự nắm bắt sự thay đổi xu hướng.
Quản lý rủi ro thiết lập Stop Loss Stop, kiểm soát rủi ro hiệu quả.
Quản lý vị trí theo đợt nhập cảnh và đợt dừng để tối đa hóa lợi nhuận.
Các tham số đã được kiểm tra tối ưu hóa nhiều lần, đảm bảo tính ổn định của tham số.
Dữ liệu phản hồi đầy đủ, mô phỏng môi trường giao dịch thực tế.
Lập trình của nó rất đơn giản và dễ hiểu.
Chiến lược này cũng có những rủi ro sau:
Sự biến động bất thường của thị trường đã dẫn đến việc phá vỡ lệnh dừng.
Các loại giao dịch không đủ thanh khoản sẽ không thể dừng lỗ. Các loại giao dịch có tính thanh khoản tốt nên được chọn.
Rủi ro hệ thống gây ra sự nhảy vọt bất thường. Cần giảm đòn bẩy và giữ tài sản có nền tảng giá trị tốt.
Các tham số được tối ưu hóa quá mức dẫn đến các đường cong quá đẹp. Các tham số nên được làm suy yếu thích hợp để cải thiện sự ổn định.
Chi phí điểm trượt do tần số giao dịch quá cao.
Tác dụng của tín hiệu yếu cần được cập nhật kịp thời. Các thiết lập tham số nên được kiểm tra và tối ưu hóa thường xuyên.
Chính sách này có thể được tối ưu hóa thêm bằng cách:
Kiểm tra thêm các kết hợp chỉ số như MACD, KD để tìm kiếm một kết hợp tốt hơn.
Cài đặt tham số chu kỳ MA tối ưu hóa để nhận ra xu hướng chủ đạo rõ ràng hơn.
Tối ưu hóa hệ số dừng để có được tỷ lệ lợi nhuận rủi ro tốt nhất.
Kiểm tra sức mạnh của các tham số khác nhau và tìm kiếm sự kết hợp tham số tốt nhất.
Thêm mô hình học máy hỗ trợ phân tích tín hiệu giao dịch.
Thêm các thuật toán dừng lỗ thích ứng để dừng lỗ gần hơn với biến động thực tế.
Thiết lập tham số chu kỳ dài hơn, mở rộng phạm vi dừng.
Chiến lược này sử dụng nhiều chỉ số tổng hợp để lọc các tín hiệu giả định định hướng xu hướng, thiết lập các biện pháp ngăn chặn và kiểm soát rủi ro, và liên tục nâng cao hiệu quả chiến lược thông qua tối ưu hóa tham số và điều chỉnh danh mục. Mặc dù không có chiến lược nào có thể dự đoán tương lai một cách hoàn hảo, nhưng kế hoạch giao dịch của hệ thống kết hợp với quản lý rủi ro tốt sẽ làm tăng đáng kể khả năng lợi nhuận.
/*backtest
start: 2023-10-09 00:00:00
end: 2023-10-13 00:00:00
period: 3m
basePeriod: 1m
exchanges: [{"eid":"Futures_Binance","currency":"BTC_USDT"}]
*/
// This source code is subject to the terms of the Mozilla Public License 2.0 at https://mozilla.org/MPL/2.0/
// © myn
//@version=5
strategy('Strategy Myth-Busting #6 - PSAR+MA+SQZMOM+HVI - [MYN]', max_bars_back=5000, overlay=true, pyramiding=0, initial_capital=20000, currency='USD', default_qty_type=strategy.percent_of_equity, default_qty_value=100.0, commission_value=0.075, use_bar_magnifier = false)
/////////////////////////////////////
//* Put your strategy logic below *//
/////////////////////////////////////
// dOg28adjYWY
//Trading Strategies Used
// Parabolic Sar
// 10 in 1 MA's
// Squeeze Momentum
// HawkEYE Volume Indicator
// Long Condition
// Parabolic Sar shift below price at last dot above and then previous bar needs to breach above that.
// Price action has to be below both MA's and 50MA needs to be above 200MA
// Squeeze Momentum needsd to be in green or close to going green
// HawkEYE Volume Indicator needs to be show a green bar on the histagram
// Short Condition
// Parabolic Sar shift above price at last dot below and then previous bar needs to breach below that.
// Price action needs to be above both MA's and 50MA needs to be below 200MA
// Squeeze Momentum needsd to be in red or close to going red
// HawkEYE Volume Indicator needs to be show a red bar on the histagram
// Parabolic SAR
//░░░░░░░░░░░░░░░░░░░░░░░░░░░░░░░░░░░░░░░░░░░░░░░░░░░░░░░░░░░░░░░░░░░░░░░░░░░░░░░░░░░░░░░░░░░░░░░░░░░░░░░░░░░░░░░░░░░░░░░░░░░░░░░░░░░░░░░░░░░░░░░░░░
//@version=5
//indicator(title="Parabolic SAR", shorttitle="SAR", overlay=true, timeframe="", timeframe_gaps=true)
// Dynamic Max based on trendcode
int TrendCodeAdaptive = switch timeframe.multiplier
1 => 1
3 => 1
5 => 1
10 => 2
15 => 3
30 => 5
45 => 5
60 => 7
120 => 9
180 => 9
240 => 13
300 => 14
360 => 15
=>
int(4)
bool overrideAdaptiveSar = input(false, title="Override Adaptive PSAR", group="Adaptive Parabolic Sar")
TrendCodeOverRide = input(5, title='Trend Code (If Overriding Adaptive PSAR)')
startPSAR = 0.02
increment = 0.02
maximum = overrideAdaptiveSar ? TrendCodeOverRide * 0.005 : TrendCodeAdaptive * 0.005
PSAR = ta.sar(startPSAR, increment, maximum)
plot(PSAR, "ParabolicSAR", style=plot.style_cross, color=color.green)
//PSARLongEntry = PSAR < close ? 1 : na
//PSARShortEntry = PSAR < close ? na : -1
PSARLongEntry = high < PSAR and barstate.isconfirmed
PSARShortEntry = low > PSAR and barstate.isconfirmed
// Squeeze Momentum
//░░░░░░░░░░░░░░░░░░░░░░░░░░░░░░░░░░░░░░░░░░░░░░░░░░░░░░░░░░░░░░░░░░░░░░░░░░░░░░░░░░░░░░░░░░░░░░░░░░░░░░░░░░░░░░░░░░░░░░░░░░░░░░░░░░░░░░░░░░░░░░░░░░
//@version=5
// @author LazyBear
// List of all my indicators: https://www.tradingview.com/v/4IneGo8h/
//
//indicator(shorttitle='SQZMOM_LB', title='Squeeze Momentum Indicator [LazyBear]', overlay=false)
lengthBB = input(20, title='BB Length', group="Squeeze Momentum")
mult = input(2.0, title='BB MultFactor')
lengthKC = input(20, title='KC Length')
multKC = input(1.5, title='KC MultFactor')
useTrueRange = input(true, title='Use TrueRange (KC)')
// Calculate BB
source = close
basis = ta.sma(source, lengthBB)
dev = multKC * ta.stdev(source, lengthBB)
upperBB = basis + dev
lowerBB = basis - dev
// Calculate KC
ma = ta.sma(source, lengthKC)
range_1 = useTrueRange ? ta.tr : high - low
rangema = ta.sma(range_1, lengthKC)
upperKC = ma + rangema * multKC
lowerKC = ma - rangema * multKC
sqzOn = lowerBB > lowerKC and upperBB < upperKC
sqzOff = lowerBB < lowerKC and upperBB > upperKC
noSqz = sqzOn == false and sqzOff == false
val = ta.linreg(source - math.avg(math.avg(ta.highest(high, lengthKC), ta.lowest(low, lengthKC)), ta.sma(close, lengthKC)), lengthKC, 0)
iff_1 = val > nz(val[1]) ? color.lime : color.green
iff_2 = val < nz(val[1]) ? color.red : color.maroon
bcolor = val > 0 ? iff_1 : iff_2
scolor = noSqz ? color.blue : sqzOn ? color.black : color.gray
//plot(val, color=bcolor, style=plot.style_histogram, linewidth=4)
//plot(0, color=scolor, style=plot.style_cross, linewidth=2)
SQZMOMLongEntry = val > 0
SQZMOMShortEntry = val < 0
// 10 in 1 Different Moving Averages
//░░░░░░░░░░░░░░░░░░░░░░░░░░░░░░░░░░░░░░░░░░░░░░░░░░░░░░░░░░░░░░░░░░░░░░░░░░░░░░░░░░░░░░░░░░░░░░░░░░░░░░░░░░░░░░░░░░░░░░░░░░░░░░░░░░░░░░░░░░░░░░░░░░
// © hiimannshu
//@version=5
// This indicator is just a simple indicator which plot any kind of multiple (atmost 10) moving everage (sma/ema/wma/rma/hma/vwma) on chart.
// Enjoy the new update
//indicator(title='10 in 1 Different Moving Averages ( SMA/EMA/WMA/RMA/HMA/VWMA )', shorttitle=' 10 in 1 MAs', overlay=true)
bool plot_ma_1 = input.bool(true, '', inline='MA 1',group= "Multi Timeframe Moving Averages")
string ma_1_type = input.string(defval='EMA', title='MA 1', options=['RMA', 'SMA', 'EMA', 'WMA','HMA','VWMA'], inline='MA 1',group= "Multi Timeframe Moving Averages")
int ma_1_val = input.int(200, '', minval=1, inline='MA 1',group= "Multi Timeframe Moving Averages")
ma1_tf = input.timeframe(title='', defval='', inline='MA 1',group= "Multi Timeframe Moving Averages")
color ma_1_colour = input.color(color.green, '', inline='MA 1',group= "Multi Timeframe Moving Averages")
bool plot_ma_2 = input.bool(true, '', inline='MA 2',group= "Multi Timeframe Moving Averages")
string ma_2_type = input.string(defval='SMA', title='MA 2 ', options=['RMA', 'SMA', 'EMA', 'WMA','HMA','VWMA'], inline='MA 2',group= "Multi Timeframe Moving Averages")
int ma_2_val = input.int(50, '', minval=1, inline='MA 2',group= "Multi Timeframe Moving Averages")
ma2_tf = input.timeframe(title='', defval='', inline='MA 2',group= "Multi Timeframe Moving Averages")
color ma_2_colour = input.color(color.yellow, '', inline='MA 2',group= "Multi Timeframe Moving Averages")
bool plot_ma_3 = input.bool(false, '', inline='MA 3',group= "Multi Timeframe Moving Averages")
string ma_3_type = input.string(defval='SMA', title='MA 3 ', options=['RMA', 'SMA', 'EMA', 'WMA','HMA','VWMA'], inline='MA 3',group= "Multi Timeframe Moving Averages")
int ma_3_val = input.int(1, '', minval=1, inline='MA 3',group= "Multi Timeframe Moving Averages")
ma3_tf = input.timeframe(title='', defval='', inline='MA 3',group= "Multi Timeframe Moving Averages")
color ma_3_colour = input.color(color.black, '', inline='MA 3',group= "Multi Timeframe Moving Averages")
bool plot_ma_4 = input.bool(false, '', inline='MA 4',group= "Multi Timeframe Moving Averages")
string ma_4_type = input.string(defval='SMA', title='MA 4 ', options=['RMA', 'SMA', 'EMA', 'WMA','HMA','VWMA'], inline='MA 4',group= "Multi Timeframe Moving Averages")
int ma_4_val = input.int(1, '', minval=1, inline='MA 4',group= "Multi Timeframe Moving Averages")
ma4_tf = input.timeframe(title='', defval='', inline='MA 4',group= "Multi Timeframe Moving Averages")
color ma_4_colour = input.color(color.black, '', inline='MA 4',group= "Multi Timeframe Moving Averages")
bool plot_ma_5 = input.bool(false, '', inline='MA 5',group= "Multi Timeframe Moving Averages")
string ma_5_type = input.string(defval='SMA', title='MA 5 ', options=['RMA', 'SMA', 'EMA', 'WMA','HMA','VWMA'], inline='MA 5',group= "Multi Timeframe Moving Averages")
int ma_5_val = input.int(1, '', minval=1, inline='MA 5',group= "Multi Timeframe Moving Averages")
ma5_tf = input.timeframe(title='', defval='', inline='MA 5',group= "Multi Timeframe Moving Averages")
color ma_5_colour = input.color(color.black, '', inline='MA 5',group= "Multi Timeframe Moving Averages")
bool plot_ma_6 = input.bool(false, '', inline='MA 6',group= "Normal Moving Averages")
string ma_6_type = input.string(defval='SMA', title='MA 6 ', options=['RMA', 'SMA', 'EMA', 'WMA','HMA','VWMA'], inline='MA 6',group= "Normal Moving Averages")
int ma_6_val = input.int(1, '', minval=1, inline='MA 6',group= "Normal Moving Averages")
ma_6_src = input.source(defval=close, title='', inline='MA 6',group= "Normal Moving Averages")
color ma_6_colour = input.color(color.black, '', inline='MA 6',group= "Normal Moving Averages")
bool plot_ma_7 = input.bool(false, '', inline='MA 7',group= "Normal Moving Averages")
string ma_7_type = input.string(defval='SMA', title='MA 7 ', options=['RMA', 'SMA', 'EMA', 'WMA','HMA','VWMA'], inline='MA 7',group= "Normal Moving Averages")
int ma_7_val = input.int(1, '', minval=1, inline='MA 7',group= "Normal Moving Averages")
ma_7_src = input.source(defval=close, title='', inline='MA 7',group= "Normal Moving Averages")
color ma_7_colour = input.color(color.black, '', inline='MA 7',group= "Normal Moving Averages")
bool plot_ma_8 = input.bool(false, '', inline='MA 8',group= "Normal Moving Averages")
string ma_8_type = input.string(defval='SMA', title='MA 8', options=['RMA', 'SMA', 'EMA', 'WMA','HMA','VWMA'], inline='MA 8',group= "Normal Moving Averages")
int ma_8_val = input.int(1, '', minval=1, inline='MA 8',group= "Normal Moving Averages")
ma_8_src = input.source(defval=close, title='', inline='MA 8',group= "Normal Moving Averages")
color ma_8_colour = input.color(color.black, '', inline='MA 8',group= "Normal Moving Averages")
bool plot_ma_9 = input.bool(false, '', inline='MA 9',group= "Normal Moving Averages")
string ma_9_type = input.string(defval='SMA', title='MA 9 ', options=['RMA', 'SMA', 'EMA', 'WMA','HMA','VWMA'], inline='MA 9',group= "Normal Moving Averages")
int ma_9_val = input.int(1, '', minval=1, inline='MA 9',group= "Normal Moving Averages")
ma_9_src = input.source(defval=close, title='', inline='MA 9',group= "Normal Moving Averages")
color ma_9_colour = input.color(color.black, '', inline='MA 9',group= "Normal Moving Averages")
bool plot_ma_10 = input.bool(false, '', inline='MA 10',group= "Normal Moving Averages")
string ma_10_type = input.string(defval='SMA', title='MA 10', options=['RMA', 'SMA', 'EMA', 'WMA','HMA','VWMA'], inline='MA 10',group= "Normal Moving Averages")
int ma_10_val = input.int(1, '', minval=1, inline='MA 10',group= "Normal Moving Averages")
ma_10_src = input.source(defval=close, title='', inline='MA 10',group= "Normal Moving Averages")
color ma_10_colour = input.color(color.black, '', inline='MA 10',group= "Normal Moving Averages")
ma_function(source, length, type) =>
if type == 'RMA'
ta.rma(source, length)
else if type == 'SMA'
ta.sma(source, length)
else if type == 'EMA'
ta.ema(source, length)
else if type == 'WMA'
ta.wma(source, length)
else if type == 'HMA'
if(length<2)
ta.hma(source,2)
else
ta.hma(source, length)
else
ta.vwma(source, length)
ma_1 = plot_ma_1 ? request.security(syminfo.tickerid, ma1_tf, ma_function(close, ma_1_val, ma_1_type)):0
ma_2 = plot_ma_2 ?request.security(syminfo.tickerid, ma2_tf, ma_function(close, ma_2_val, ma_2_type)):0
ma_3 = plot_ma_3 ?request.security(syminfo.tickerid, ma3_tf, ma_function(close, ma_3_val, ma_3_type)):0
ma_4 = plot_ma_4 ? request.security(syminfo.tickerid, ma4_tf, ma_function(close, ma_4_val, ma_4_type)):0
ma_5 = plot_ma_5 ?request.security(syminfo.tickerid, ma5_tf, ma_function(close, ma_5_val, ma_5_type)):0
ma_6 = plot_ma_6 ?ma_function(ma_6_src, ma_6_val, ma_6_type):0
ma_7 = plot_ma_7 ?ma_function(ma_7_src, ma_7_val, ma_7_type):0
ma_8 = plot_ma_8 ?ma_function(ma_8_src, ma_8_val, ma_8_type):0
ma_9 = plot_ma_9 ?ma_function(ma_9_src, ma_9_val, ma_9_type):0
ma_10 = plot_ma_10 ?ma_function(ma_10_src, ma_10_val, ma_10_type):0
plot(plot_ma_1 ? ma_1 : na, 'MA 1', ma_1_colour)
plot(plot_ma_2 ? ma_2 : na, 'MA 2', ma_2_colour)
plot(plot_ma_3 ? ma_3 : na, 'MA 3', ma_3_colour)
plot(plot_ma_4 ? ma_4 : na, 'MA 4', ma_4_colour)
plot(plot_ma_5 ? ma_5 : na, 'MA 5', ma_5_colour)
plot(plot_ma_6 ? ma_6 : na, 'MA 6', ma_6_colour)
plot(plot_ma_7 ? ma_7 : na, 'MA 7', ma_7_colour)
plot(plot_ma_8 ? ma_8 : na, 'MA 8', ma_8_colour)
plot(plot_ma_9 ? ma_9 : na, 'MA 9', ma_9_colour)
plot(plot_ma_10 ? ma_10 : na, 'MA 10', ma_10_colour)
// Long entry - Price has to be below both MA's and 50MA needs to be above 200MA
MALongEntry = (close > ma_1 and close > ma_2) and (ma_2 > ma_1)
// Short Entry - Price has to be above both MA's and 50MA needs to be below 200MA
MAShortEntry = (close < ma_1 and close < ma_2) and (ma_2 < ma_1)
// HawkEYE Volume Indicator
//░░░░░░░░░░░░░░░░░░░░░░░░░░░░░░░░░░░░░░░░░░░░░░░░░░░░░░░░░░░░░░░░░░░░░░░░░░░░░░░░░░░░░░░░░░░░░░░░░░░░░░░░░░░░░░░░░░░░░░░░░░░░░░░░░░░░░░░░░░░░░░░░░░
//@version=5
// @author LazyBear
// If you use this code, in its original or modified form, do drop me a note. Thx.
//
//indicator('HawkEye Volume Indicator [LazyBear]', shorttitle='HVI_LB')
lengthhvi = input(200, group="HawkEye Volume Indicator")
range_1HVI = high - low
rangeAvg = ta.sma(range_1HVI, lengthhvi)
volumeA = ta.sma(volume, lengthhvi)
divisor = input(1)
high1 = high[1]
low1 = low[1]
mid1 = hl2[1]
u1 = mid1 + (high1 - low1) / divisor
d1 = mid1 - (high1 - low1) / divisor
r_enabled1 = range_1HVI > rangeAvg and close < d1 and volume > volumeA
r_enabled2 = close < mid1
r_enabled = r_enabled1 or r_enabled2
g_enabled1 = close > mid1
g_enabled2 = range_1HVI > rangeAvg and close > u1 and volume > volumeA
g_enabled3 = high > high1 and range_1HVI < rangeAvg / 1.5 and volume < volumeA
g_enabled4 = low < low1 and range_1HVI < rangeAvg / 1.5 and volume > volumeA
g_enabled = g_enabled1 or g_enabled2 or g_enabled3 or g_enabled4
gr_enabled1 = range_1HVI > rangeAvg and close > d1 and close < u1 and volume > volumeA and volume < volumeA * 1.5 and volume > volume[1]
gr_enabled2 = range_1HVI < rangeAvg / 1.5 and volume < volumeA / 1.5
gr_enabled3 = close > d1 and close < u1
gr_enabled = gr_enabled1 or gr_enabled2 or gr_enabled3
v_color = gr_enabled ? color.gray : g_enabled ? color.green : r_enabled ? color.red : color.blue
//plot(volume, style=plot.style_histogram, color=v_color, linewidth=5)
HVILongEntry = g_enabled
HVIShortEntry = r_enabled
//////////////////////////////////////
//* Put your strategy rules below *//
/////////////////////////////////////
longCondition = PSARLongEntry and MALongEntry and HVILongEntry and SQZMOMLongEntry
shortCondition = PSARShortEntry and MAShortEntry and HVIShortEntry and SQZMOMShortEntry
//define as 0 if do not want to use
closeLongCondition = 0
closeShortCondition = 0
// ADX
//░░░░░░░░░░░░░░░░░░░░░░░░░░░░░░░░░░░░░░░░░░░░░░░░░░░░░░░░░░░░░░░░░░░░░░░░░░░░░░░░░░░░░░░░░░░░░░░░░░░░░░░░░░░░░░░░░░░░░░░░░░░░░░░░░░░░░░░░░░░░░░░░░░
adxEnabled = input.bool(defval = false , title = "Average Directional Index (ADX)", tooltip = "", group ="ADX" )
adxlen = input(14, title="ADX Smoothing", group="ADX")
adxdilen = input(14, title="DI Length", group="ADX")
adxabove = input(25, title="ADX Threshold", group="ADX")
adxdirmov(len) =>
adxup = ta.change(high)
adxdown = -ta.change(low)
adxplusDM = na(adxup) ? na : (adxup > adxdown and adxup > 0 ? adxup : 0)
adxminusDM = na(adxdown) ? na : (adxdown > adxup and adxdown > 0 ? adxdown : 0)
adxtruerange = ta.rma(ta.tr, len)
adxplus = fixnan(100 * ta.rma(adxplusDM, len) / adxtruerange)
adxminus = fixnan(100 * ta.rma(adxminusDM, len) / adxtruerange)
[adxplus, adxminus]
adx(adxdilen, adxlen) =>
[adxplus, adxminus] = adxdirmov(adxdilen)
adxsum = adxplus + adxminus
adx = 100 * ta.rma(math.abs(adxplus - adxminus) / (adxsum == 0 ? 1 : adxsum), adxlen)
adxsig = adxEnabled ? adx(adxdilen, adxlen) : na
isADXEnabledAndAboveThreshold = adxEnabled ? (adxsig > adxabove) : true
//Backtesting Time Period (Input.time not working as expected as of 03/30/2021. Giving odd start/end dates
//░░░░░░░░░░░░░░░░░░░░░░░░░░░░░░░░░░░░░░░░░░░░░░░░░░░░░░░░░░░░░░░░░░░░░░░░░░░░░░░░░░░░░░░░░░░░░░░░░░░░░░░░░░░░░░░░░░░░░░░░░░░░░░░░░░░░░░░░░░░░░░░░░░
useStartPeriodTime = input.bool(true, 'Start', group='Date Range', inline='Start Period')
startPeriodTime = input(timestamp('1 Jan 2019'), '', group='Date Range', inline='Start Period')
useEndPeriodTime = input.bool(true, 'End', group='Date Range', inline='End Period')
endPeriodTime = input(timestamp('31 Dec 2030'), '', group='Date Range', inline='End Period')
start = useStartPeriodTime ? startPeriodTime >= time : false
end = useEndPeriodTime ? endPeriodTime <= time : false
calcPeriod = true
// Trade Direction
// ░░░░░░░░░░░░░░░░░░░░░░░░░░░░░░░░░░░░░░░░░░░░░░░░░░░░░░░░░░░░░░░░░░░░░░░░░░░░░░░░░░░░░░░░░░░░░░░░░░░░░░░░░░░░░░░░░░░░░░░░░░░░░░░░░░░░░░░░░░░░░░░░░░
tradeDirection = input.string('Long and Short', title='Trade Direction', options=['Long and Short', 'Long Only', 'Short Only'], group='Trade Direction')
// Percent as Points
// ░░░░░░░░░░░░░░░░░░░░░░░░░░░░░░░░░░░░░░░░░░░░░░░░░░░░░░░░░░░░░░░░░░░░░░░░░░░░░░░░░░░░░░░░░░░░░░░░░░░░░░░░░░░░░░░░░░░░░░░░░░░░░░░░░░░░░░░░░░░░░░░░░░
per(pcnt) =>
strategy.position_size != 0 ? math.round(pcnt / 100 * strategy.position_avg_price / syminfo.mintick) : float(na)
// Take profit 1
// ░░░░░░░░░░░░░░░░░░░░░░░░░░░░░░░░░░░░░░░░░░░░░░░░░░░░░░░░░░░░░░░░░░░░░░░░░░░░░░░░░░░░░░░░░░░░░░░░░░░░░░░░░░░░░░░░░░░░░░░░░░░░░░░░░░░░░░░░░░░░░░░░░░
tp1 = input.float(title='Take Profit 1 - Target %', defval=100, minval=0.0, step=0.5, group='Take Profit', inline='Take Profit 1')
q1 = input.int(title='% Of Position', defval=100, minval=0, group='Take Profit', inline='Take Profit 1')
// Take profit 2
// ░░░░░░░░░░░░░░░░░░░░░░░░░░░░░░░░░░░░░░░░░░░░░░░░░░░░░░░░░░░░░░░░░░░░░░░░░░░░░░░░░░░░░░░░░░░░░░░░░░░░░░░░░░░░░░░░░░░░░░░░░░░░░░░░░░░░░░░░░░░░░░░░░░
tp2 = input.float(title='Take Profit 2 - Target %', defval=100, minval=0.0, step=0.5, group='Take Profit', inline='Take Profit 2')
q2 = input.int(title='% Of Position', defval=100, minval=0, group='Take Profit', inline='Take Profit 2')
// Take profit 3
// ░░░░░░░░░░░░░░░░░░░░░░░░░░░░░░░░░░░░░░░░░░░░░░░░░░░░░░░░░░░░░░░░░░░░░░░░░░░░░░░░░░░░░░░░░░░░░░░░░░░░░░░░░░░░░░░░░░░░░░░░░░░░░░░░░░░░░░░░░░░░░░░░░░
tp3 = input.float(title='Take Profit 3 - Target %', defval=100, minval=0.0, step=0.5, group='Take Profit', inline='Take Profit 3')
q3 = input.int(title='% Of Position', defval=100, minval=0, group='Take Profit', inline='Take Profit 3')
// Take profit 4
// ░░░░░░░░░░░░░░░░░░░░░░░░░░░░░░░░░░░░░░░░░░░░░░░░░░░░░░░░░░░░░░░░░░░░░░░░░░░░░░░░░░░░░░░░░░░░░░░░░░░░░░░░░░░░░░░░░░░░░░░░░░░░░░░░░░░░░░░░░░░░░░░░░░
tp4 = input.float(title='Take Profit 4 - Target %', defval=100, minval=0.0, step=0.5, group='Take Profit')
/// Stop Loss
// ░░░░░░░░░░░░░░░░░░░░░░░░░░░░░░░░░░░░░░░░░░░░░░░░░░░░░░░░░░░░░░░░░░░░░░░░░░░░░░░░░░░░░░░░░░░░░░░░░░░░░░░░░░░░░░░░░░░░░░░░░░░░░░░░░░░░░░░░░░░░░░░░░░
stoplossPercent = input.float(title='Stop Loss (%)', defval=999, minval=0.01, group='Stop Loss') * 0.01
slLongClose = close < strategy.position_avg_price * (1 - stoplossPercent)
slShortClose = close > strategy.position_avg_price * (1 + stoplossPercent)
/// Leverage
// ░░░░░░░░░░░░░░░░░░░░░░░░░░░░░░░░░░░░░░░░░░░░░░░░░░░░░░░░░░░░░░░░░░░░░░░░░░░░░░░░░░░░░░░░░░░░░░░░░░░░░░░░░░░░░░░░░░░░░░░░░░░░░░░░░░░░░░░░░░░░░░░░░░
leverage = input.float(1, 'Leverage', step=.5, group='Leverage')
contracts = math.min(math.max(.000001, strategy.equity / close * leverage), 1000000000)
/// Trade State Management
// ░░░░░░░░░░░░░░░░░░░░░░░░░░░░░░░░░░░░░░░░░░░░░░░░░░░░░░░░░░░░░░░░░░░░░░░░░░░░░░░░░░░░░░░░░░░░░░░░░░░░░░░░░░░░░░░░░░░░░░░░░░░░░░░░░░░░░░░░░░░░░░░░░░
isInLongPosition = strategy.position_size > 0
isInShortPosition = strategy.position_size < 0
/// ProfitView Alert Syntax String Generation
// ░░░░░░░░░░░░░░░░░░░░░░░░░░░░░░░░░░░░░░░░░░░░░░░░░░░░░░░░░░░░░░░░░░░░░░░░░░░░░░░░░░░░░░░░░░░░░░░░░░░░░░░░░░░░░░░░░░░░░░░░░░░░░░░░░░░░░░░░░░░░░░░░░░
alertSyntaxPrefix = input.string(defval='CRYPTANEX_99FTX_Strategy-Name-Here', title='Alert Syntax Prefix', group='ProfitView Alert Syntax')
alertSyntaxBase = alertSyntaxPrefix + '\n#' + str.tostring(open) + ',' + str.tostring(high) + ',' + str.tostring(low) + ',' + str.tostring(close) + ',' + str.tostring(volume) + ','
/// Trade Execution
// ░░░░░░░░░░░░░░░░░░░░░░░░░░░░░░░░░░░░░░░░░░░░░░░░░░░░░░░░░░░░░░░░░░░░░░░░░░░░░░░░░░░░░░░░░░░░░░░░░░░░░░░░░░░░░░░░░░░░░░░░░░░░░░░░░░░░░░░░░░░░░░░░░░
longConditionCalc = (longCondition and isADXEnabledAndAboveThreshold)
shortConditionCalc = (shortCondition and isADXEnabledAndAboveThreshold)
if calcPeriod
if longConditionCalc and tradeDirection != 'Short Only' and isInLongPosition == false
strategy.entry('Long', strategy.long, qty=contracts)
alert(message=alertSyntaxBase + 'side:long', freq=alert.freq_once_per_bar_close)
if shortConditionCalc and tradeDirection != 'Long Only' and isInShortPosition == false
strategy.entry('Short', strategy.short, qty=contracts)
alert(message=alertSyntaxBase + 'side:short', freq=alert.freq_once_per_bar_close)
//Inspired from Multiple %% profit exits example by adolgo https://www.tradingview.com/script/kHhCik9f-Multiple-profit-exits-example/
strategy.exit('TP1', qty_percent=q1, profit=per(tp1))
strategy.exit('TP2', qty_percent=q2, profit=per(tp2))
strategy.exit('TP3', qty_percent=q3, profit=per(tp3))
strategy.exit('TP4', profit=per(tp4))
strategy.close('Long', qty_percent=100, comment='SL Long', when=slLongClose)
strategy.close('Short', qty_percent=100, comment='SL Short', when=slShortClose)
strategy.close_all(when=closeLongCondition or closeShortCondition, comment='Close Postion')
/// Dashboard
// ░░░░░░░░░░░░░░░░░░░░░░░░░░░░░░░░░░░░░░░░░░░░░░░░░░░░░░░░░░░░░░░░░░░░░░░░░░░░░░░░░░░░░░░░░░░░░░░░░░░░░░░░░░░░░░░░░░░░░░░░░░░░░░░░░░░░░░░░░░░░░░░░░░
// Inspired by https://www.tradingview.com/script/uWqKX6A2/ - Thanks VertMT