Super Moving Average and Upperband Crossover Strategy

Overview
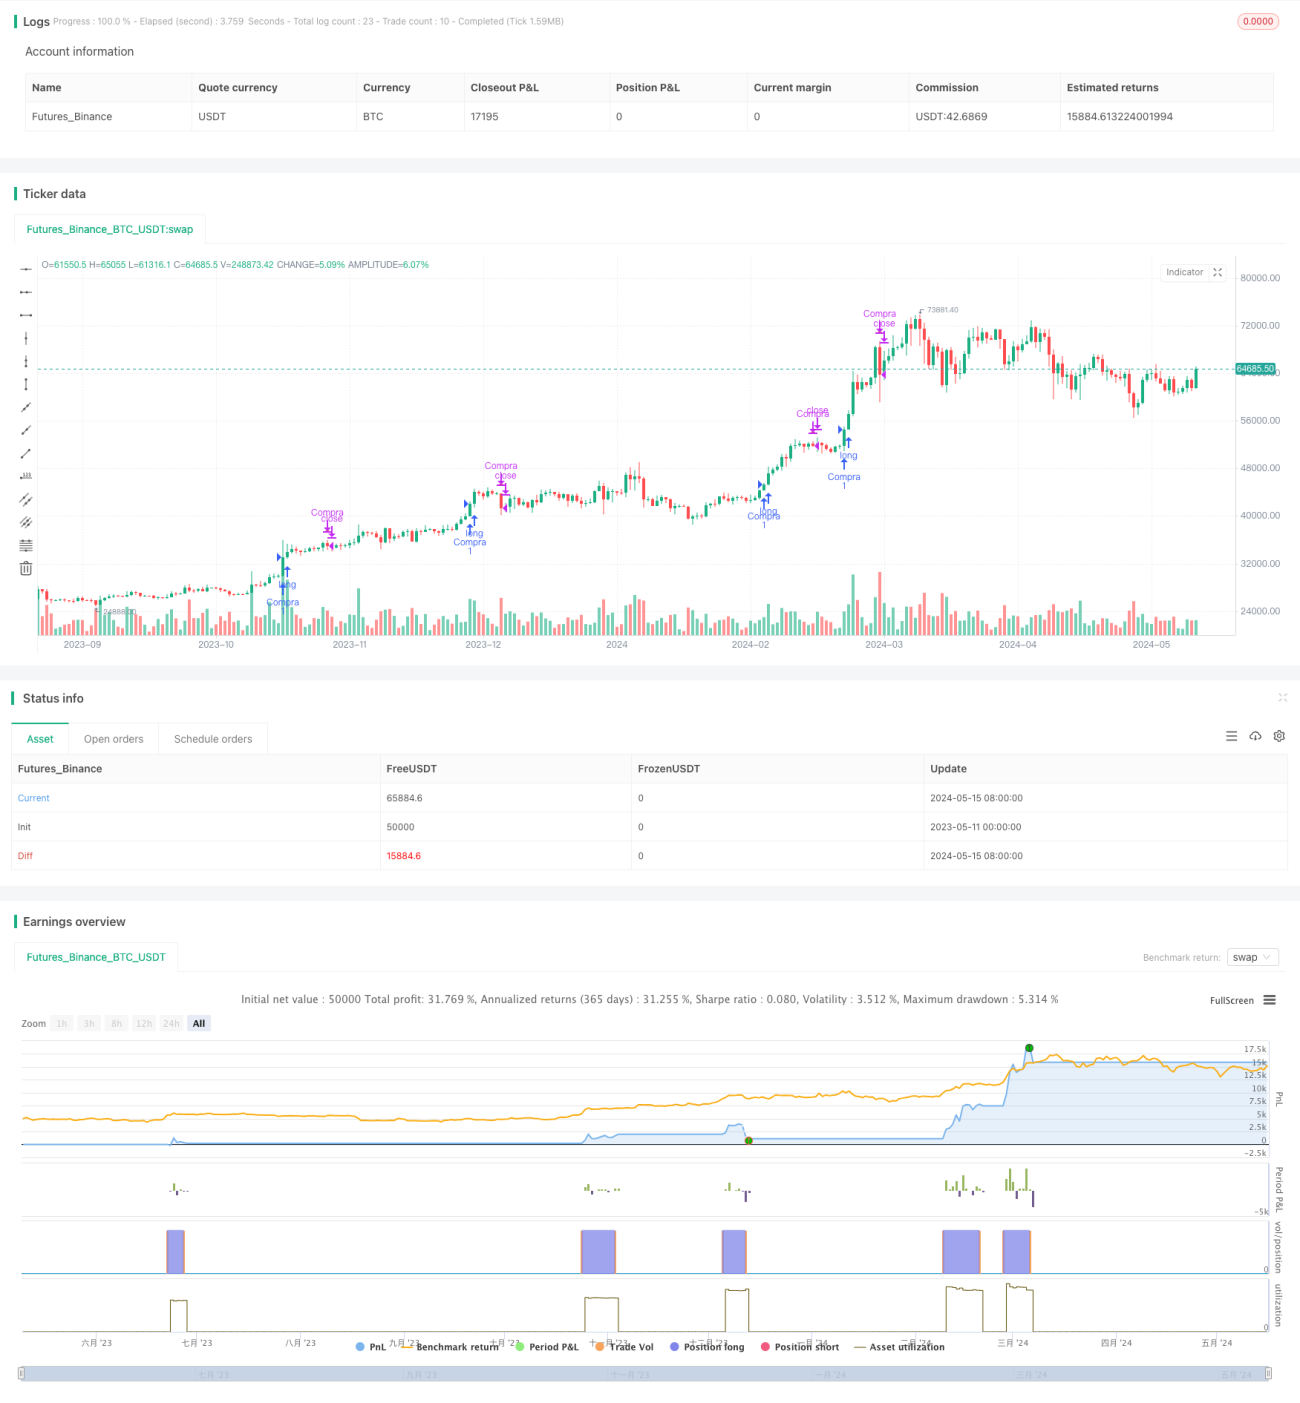
The Super Moving Average and Upperband Crossover Strategy is a quantitative trading strategy based on technical indicators. The strategy utilizes the Exponential Moving Average (EMA) and Upperband indicators to capture upward trends in the market. When the closing price breaks through the Upperband and meets certain conditions, the strategy generates a buy signal. When the closing price falls below the 3-day EMA, the strategy generates a sell signal. This strategy is suitable for markets with high trading volumes and clear trends, such as Bitcoin.
Strategy Principle
The core of this strategy is to use the EMA and Upperband technical indicators to determine market trends and timing for buying and selling. First, the strategy calculates the Upperband indicator, which takes into account price volatility. When the price deviation from the average price is large, the value of the Upperband will increase accordingly. Then, the strategy determines whether the closing price has broken through the moving average of the Upperband and whether it meets other buying conditions. If so, it generates a buy signal. After holding a position, when the closing price falls below the 3-day EMA, the strategy generates a sell signal.
Strategy Advantages
-
Suitable for markets with strong trends: This strategy performs well in upward trends and is especially suitable for instruments with high volatility and clear trends, such as Bitcoin.
-
Combines price and volatility: The Upperband indicator comprehensively considers price levels and price volatility, and can more fully reflect market conditions.
-
Simple and easy to use: The strategy logic is clear, and the indicators used are simple and easy to understand and implement.
-
Suitable for short-term trading: The strategy generates buy and sell signals frequently, making it suitable for short-term trading.
Strategy Risks
-
Oscillating market risk: In a highly volatile and trendless oscillating market, the strategy may trade frequently, resulting in large slippage and transaction costs.
-
Indicator parameter risk: The strategy is sensitive to indicator parameters, and improper parameter settings may lead to poor strategy performance.
-
Overfitting risk: The strategy performs well in specific markets but may not be able to adapt to changes in market conditions, leading to overfitting risk.
Strategy Optimization Directions
-
Introduce trend confirmation indicators: Trend confirmation indicators such as MACD can be introduced to filter out false signals in oscillating markets.
-
Optimize parameter selection: Optimal indicator parameter combinations can be found through optimization methods such as genetic algorithms.
-
Add risk control module: Risk control measures such as stop-loss and dynamic position management can be introduced to reduce strategy risk.
-
Multi-variety adaptation: Machine learning and other methods can be used to make the strategy adaptable to different varieties and market environments.
Summary
The Super Moving Average and Upperband Crossover Strategy is a simple and practical quantitative trading strategy suitable for markets with strong trends. The strategy uses EMA and Upperband indicators to capture upward trends, and its logic is clear and easy to implement. However, the strategy also has certain risks, such as oscillating market risk, parameter risk, and overfitting risk. In the future, the strategy can be optimized in terms of trend confirmation, parameter optimization, risk control, and multi-variety adaptation to improve the strategy's robustness and adaptability.
- 1