Adaptive Dynamic Trading Strategy Based on Standardized Logarithmic Returns

Overview
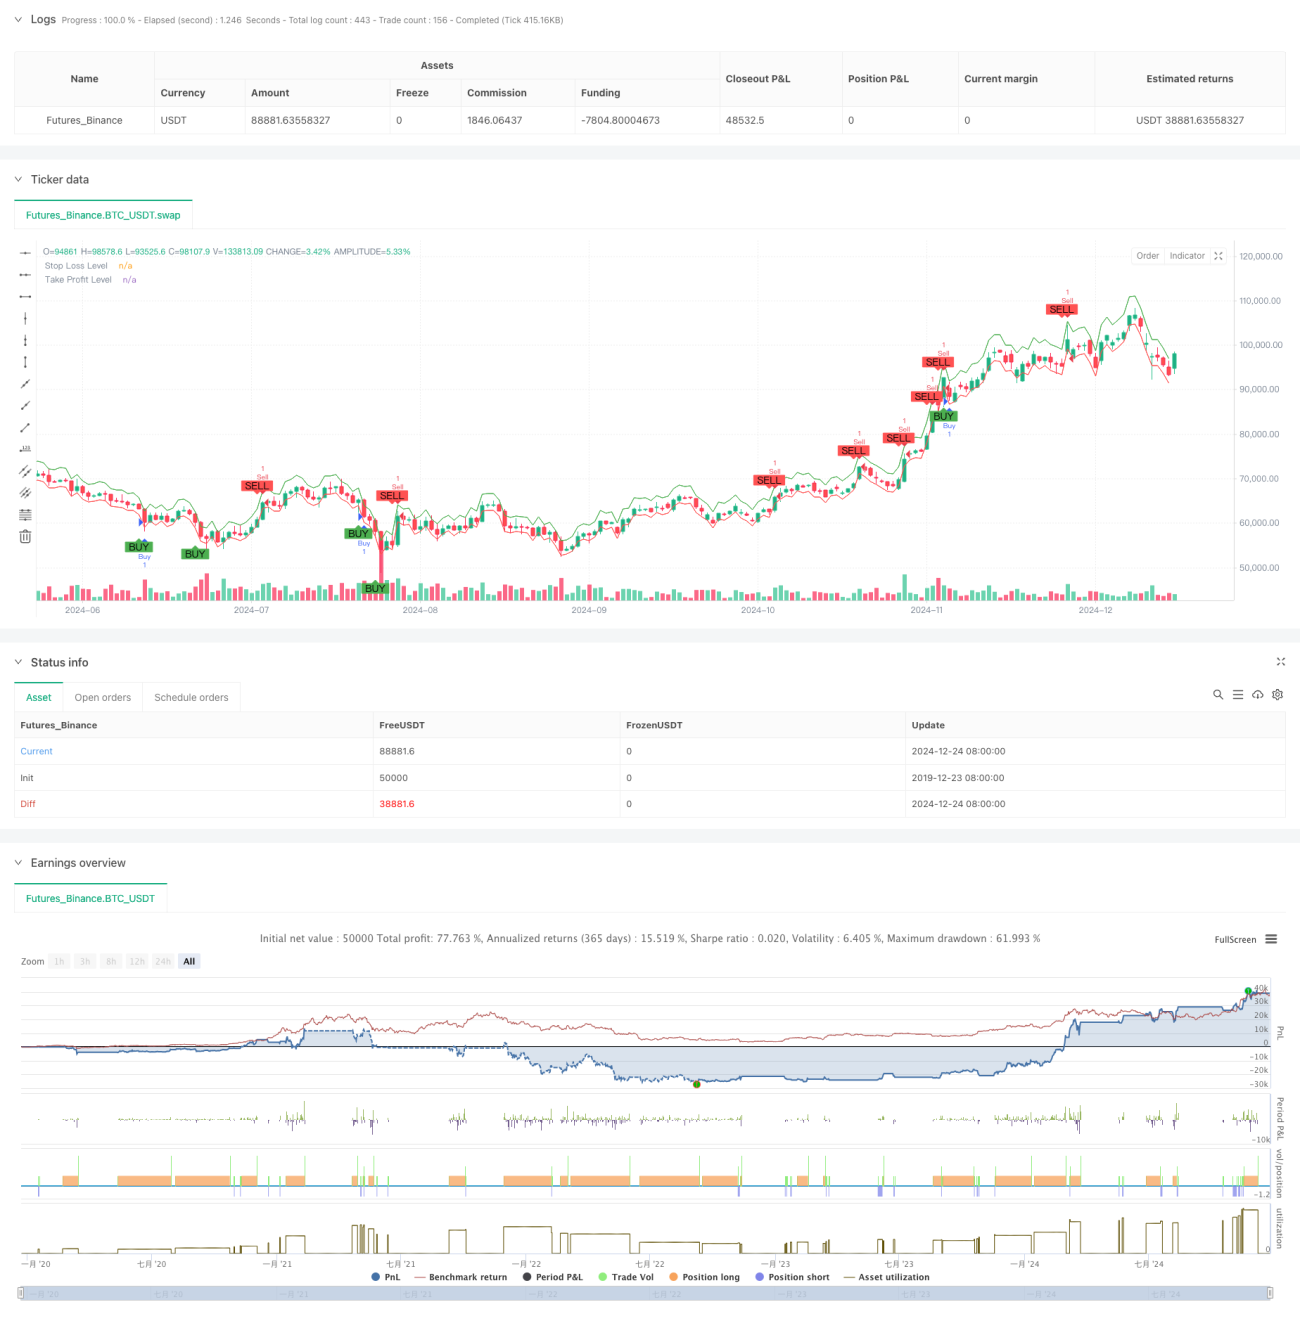
This strategy is an adaptive trading system based on the Shiryaev-Zhou Index (SZI). It identifies overbought and oversold market conditions by calculating standardized scores of logarithmic returns, aiming to capture mean reversion opportunities. The strategy incorporates dynamic stop-loss and take-profit targets for precise risk control.
Strategy Principles
The core of the strategy lies in constructing a standardized indicator using rolling statistical properties of logarithmic returns. The specific steps are:
- Calculate logarithmic returns for normalization
- Compute rolling mean and standard deviation using a 50-period window
- Construct SZI: (logarithmic return - rolling mean)/rolling standard deviation
- Generate long signals when SZI falls below -2.0 and short signals when above 2.0
- Set 2% stop-loss and 4% take-profit levels based on entry price
Strategy Advantages
- Solid Theoretical Foundation: Based on log-normal distribution assumptions with strong statistical support
- High Adaptability: Rolling window calculations adapt to changes in market volatility characteristics
- Comprehensive Risk Control: Percentage-based stop-loss strategy enables precise risk control for each trade
- User-friendly Visualization: Clear annotation of trading signals and risk control levels on charts
Strategy Risks
- Parameter Sensitivity: Strategy performance significantly affected by choice of rolling window length and thresholds
- Market Environment Dependency: May generate frequent false signals in trending markets
- Slippage Impact: Actual execution prices may significantly deviate from ideal levels during volatile periods
- Calculation Delay: Real-time computation of statistical indicators may lead to signal lag
Optimization Directions
- Dynamic Thresholds: Consider adjusting signal thresholds based on market volatility
- Multiple Time Frames: Introduce signal confirmation mechanisms across multiple timeframes
- Volatility Filtering: Pause trading or adjust positions during extreme volatility periods
- Signal Confirmation: Add volume, momentum, and other auxiliary indicators for signal confirmation
- Position Management: Implement volatility-based dynamic position sizing
Summary
This is a quantitative trading strategy built on solid statistical foundations, capturing price volatility opportunities through standardized logarithmic returns. The strategy's main strengths lie in its adaptability and comprehensive risk control, though there remains room for optimization in parameter selection and market environment adaptation. Through the introduction of dynamic thresholds and multi-dimensional signal confirmation mechanisms, the strategy's stability and reliability can be further enhanced.
- 1