
Overview
The Advanced Pullback Trading Triangle Breakout with Volume-Price Confirmation Strategy is a quantitative trading approach that combines technical pattern recognition, volume confirmation, and dynamic risk management. Optimized for 1-hour charts, the strategy offers two independent entry setups based on triangle breakout and volume-price confirmation principles. The core concept is to capture high-probability breakout opportunities while effectively managing risk through a dynamic trailing stop loss that automatically tightens when profit reaches a specific threshold. This dual entry mechanism provides flexibility across different market conditions, while the intelligent stop-loss mechanism helps balance risk and reward.
Strategy Principles
The strategy operates based on two key entry setups and a carefully designed exit mechanism:
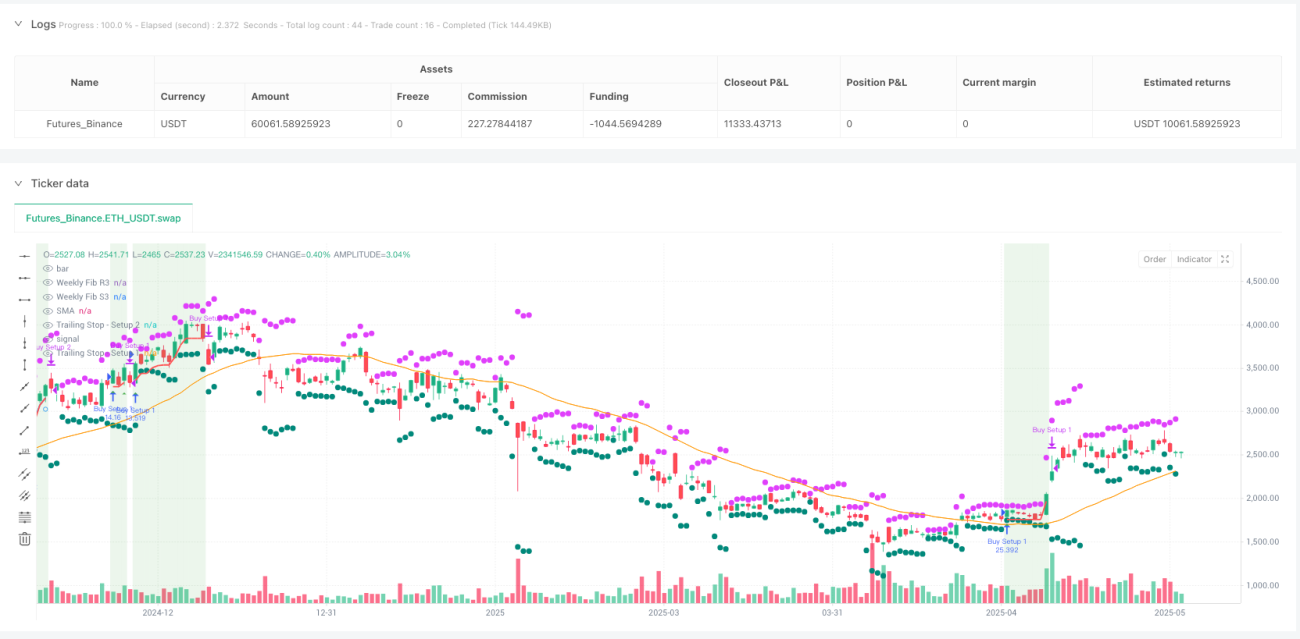
Entry Setup 1 - Golden Triangle Breakout:
- Uses recent pivot highs and lows to detect triangle formations
- Confirms a bullish breakout when price closes above the triangle top and is simultaneously above the 50-period SMA
- Entry occurs at the breakout candle close
- Ideal for capturing early momentum trades after consolidation periods
Entry Setup 2 - Price & Volume Confirmation:
- Based on mean reversion followed by volume surge:
- Price drops below the 50 SMA, then closes back above it
- Requires at least one "up day" (current close > previous close)
- Volume must be above its 50-period SMA and higher than each of the previous 4 days
- Entry occurs at the close of the volume-confirmation day
- Particularly effective when triangle patterns aren't clear but accumulation is strong
Exit Strategy - Dynamic Trailing Stop Loss:
- Initial stop set at 10% below the highest price reached after entry
- When profit reaches 10%, the trailing stop is tightened to 5%
- This mechanism allows traders to stay in the trend while securing profits
In the code implementation, the strategy uses simplified pivots to identify triangle formations and compares current price to the SMA for trend confirmation. For volume confirmation, the strategy checks if volume exceeds both its moving average and previous periods' volume. The dynamic trailing stop is implemented by continuously updating the highest price reached during the trade and calculating the corresponding stop level.
Strategy Advantages
-
Dual Entry Mechanism: By providing two independent entry setups, the strategy can adapt to different market environments, increasing the likelihood of capturing favorable trading opportunities. When markets are in distinct consolidation, Setup 1 can capture the breakout; when patterns are less obvious but show strong accumulation signs, Setup 2 can work effectively.
-
Integrated Risk Management: The built-in dynamic trailing stop mechanism automatically adapts to market movements, allowing profits to grow while protecting capital. Particularly valuable is the feature that tightens the stop once a profit threshold is reached, effectively balancing the conflicting goals of securing profit and letting winners run.
-
False Breakout Filtering: By combining SMA filtering and volume confirmation, the strategy reduces the risk of false breakouts. Price must not only break through the pattern but also remain above the SMA, and for Setup 2, have significant volume support, greatly improving signal quality.
-
Visual Aids: The strategy provides rich visual indicators, including background shading during trades, a real-time dashboard, and various plotting elements, allowing traders to easily monitor strategy status and signals.
-
Flexible Timeframe Optimization: While optimized for 1-hour charts, the strategy's parameters can be adjusted to accommodate different timeframes, increasing its range of applications.
Strategy Risks
-
Market Condition Dependency: The strategy performs best in sideways-to-bullish markets and may underperform in strongly bearish trends or highly volatile markets. In bearish environments, the risk of false breakouts increases, potentially leading to consecutive losses.
-
Slippage and Execution Risk: In real trading, especially in less liquid markets, entry and stop points may experience slippage, affecting the strategy's overall performance. To mitigate this risk, consider using limit orders instead of market orders.
-
Parameter Optimization Challenges: The strategy relies on multiple parameters (SMA length, stop-loss percentages, etc.) that need optimization for specific markets and timeframes. Improper parameter settings may lead to overfitting or underperformance.
-
Overtrading Risk: Under certain market conditions, the strategy might generate excessive signals, leading to overtrading and increased transaction costs. Implementing additional filters or cooldown periods can help reduce this risk.
-
Stop-Loss Optimization Tradeoffs: While the dynamic stop-loss mechanism is a strength of this strategy, setting stops too tight can lead to premature exits from favorable trades, while setting them too wide may result in profit giveback. Stop parameters need careful calibration based on the specific market's volatility.
Strategy Optimization Directions
-
Add Trend Filters: Integrating broader trend indicators (such as longer-term moving averages or ADX) can help the strategy trade only in favorable market directions. For example, adding a condition to only allow bullish entries when a long-term SMA (like 200-period) is sloping upward.
-
Optimize Volume Confirmation Logic: The current volume confirmation requirement of volume being higher than the previous 4 periods may be too strict or not strict enough, depending on market conditions. Implementing adaptive volume thresholds that dynamically adjust based on market volatility could improve the effectiveness of Setup 2.
-
Incorporate Time Filters: Certain trading sessions may be more conducive to this strategy than others. Adding time filters to avoid trading during unfavorable periods (such as high-volatility periods around market opens or closes) could enhance overall performance.
-
Implement Partial Profit Locking: The current exit strategy is binary (hold all or exit all). Implementing a scaling-out system that progressively reduces position size as profit increases could lock in partial profits while retaining some upside potential.
-
Add Correlated Asset Confirmation: In certain markets, confirmation from correlated assets can improve signal quality. For example, in stock trading, sector or industry strength could serve as an additional filter; in forex, the behavior of related currency pairs could provide extra confirmation.
-
Integrate Volatility Adjustments: Dynamically adjusting stop levels based on market volatility (such as ATR or historical volatility) could make the strategy better adapt to different market conditions. Using tighter stops in low-volatility environments and wider stops in high-volatility environments.
Summary
The Advanced Pullback Trading Triangle Breakout with Volume-Price Confirmation Strategy provides a comprehensive trading approach that combines technical pattern recognition, momentum principles, and volume analysis. By offering two complementary entry setups, the strategy maintains flexibility across different market conditions, while its dynamic trailing stop mechanism provides optimized risk management.
The main advantages of the strategy lie in its multifaceted entry criteria and integrated risk management, making it suitable for various trading styles from intraday to short-term swing trading. However, market condition dependency and parameter optimization challenges are the primary risks to be mindful of.
By incorporating trend filters, optimizing volume confirmation logic, or implementing volatility adjustments, traders can further enhance the strategy's performance. Ultimately, the strategy provides a solid framework that can be customized according to individual risk preferences and market characteristics, making it a valuable tool for traders seeking a technically-driven, risk-controlled trading approach.
- 1