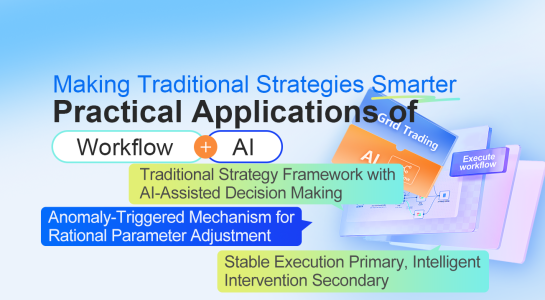
Opening: What Can Workflows Do? Many people think workflows can only handle simple automation tasks, but their capabilities are far more powerful than imagi
1. Introduction: Insights from the AI Trading Arena Recently, American AI lab nof1ai launched a compelling experiment—giving six top AI models (Claude, De
A Real Scenario 3 AM on Black Friday, you're scrolling through your phone and see BTC breaking through new lows. Your heart races, your finger hovers over
Preface For domestic users, trading US stocks is indeed quite cumbersome—it requires opening overseas bank accounts, setting up US stock trading accounts,
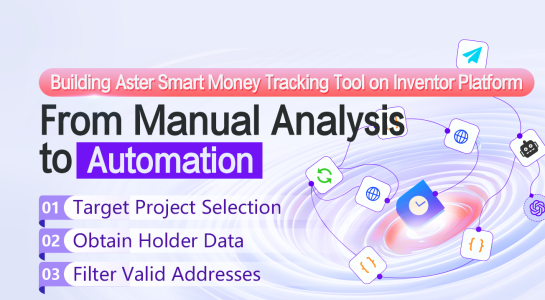
I recently came across a very interesting idea - discovering the next opportunity by analyzing other investments of successful project early holders. Simply pu
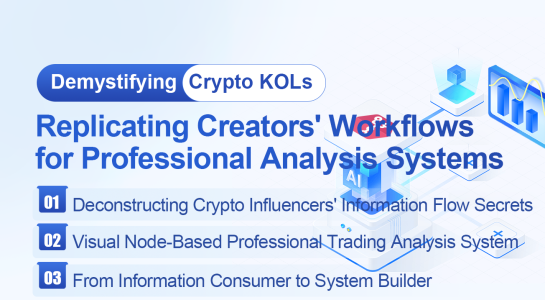
In the cryptocurrency trading field, analysts with large followings (influencers) produce professional market analysis content daily. Their information streams
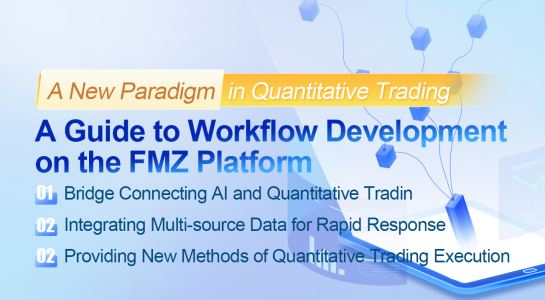
As AI technology continues to develop, quantitative trading is undergoing significant changes. The FMZ (Inventors Quantify) platform has integrated Workflow te
The digital currency market possesses a unique trading environment that provides an ideal application scenario for grid trading strategies. Compared to
Accidentally Discovered an Interesting Pine Strategy A few days ago, while browsing strategies on the Inventor forum, I came across one called "Panel Pro+
Preface In our previous article "Wash Trading Strategies in Digital Currency," we provided a detailed introduction to a strategy framework that accumulates
⚠️ Important Disclaimer **This article demonstrates a volume-boosting self-matching trading strategy intended solely for learning purposes related to tra
The Beginning of It All I've been involved in quantitative trading for a while now. To be honest, most of the time I just experiment with strategies sh
Source of Strategy Recently, I saw an interesting "Volatility Statistical Arbitrage Strategy" shared in the quantitative trading community. Although it i
In the field of technical analysis, identifying the four core price structure patterns of "higher highs (HH)", "higher lows (HL)", "lower highs (LH)" and "lo
In quantitative trading, the traditional K-line chart is one of the most commonly used data presentation forms, but it also has certain limitations, such as