পিভট পয়েন্ট সুপারট্রেন্ড
লেখক:চাওঝাং, তারিখ: ২০২২-০৫-১৭ ১৫ঃ৪৫ঃ৩৭ট্যাগঃপিভটএটিআর
হ্যালো সবাই,
এখানে অনেক ধরনের সুপারট্রেন্ড আছে। সম্প্রতি আমি পিভট পয়েন্টের উপর ভিত্তি করে একটি সুপারট্রেন্ড সম্পর্কে চিন্তা করেছি তারপর আমি
এই স্ক্রিপ্টের পিছনে ধারণাটি পিভট পয়েন্ট খুঁজে পাওয়া, তাদের গড় গণনা করা এবং সুপারট্রেন্ডের মতো এটিআর দ্বারা উচ্চতর / নিম্নতর ব্যান্ড তৈরি করা। আপনি অ্যালগরিদমটিতে দেখতে পাচ্ছেন স্ক্রিপ্টটি অতীত পিভট পয়েন্টগুলিতে ওজন দেয়, এটি কিছুটা মসৃণ করার জন্য করা হয়।
ব্যাকটেস্ট
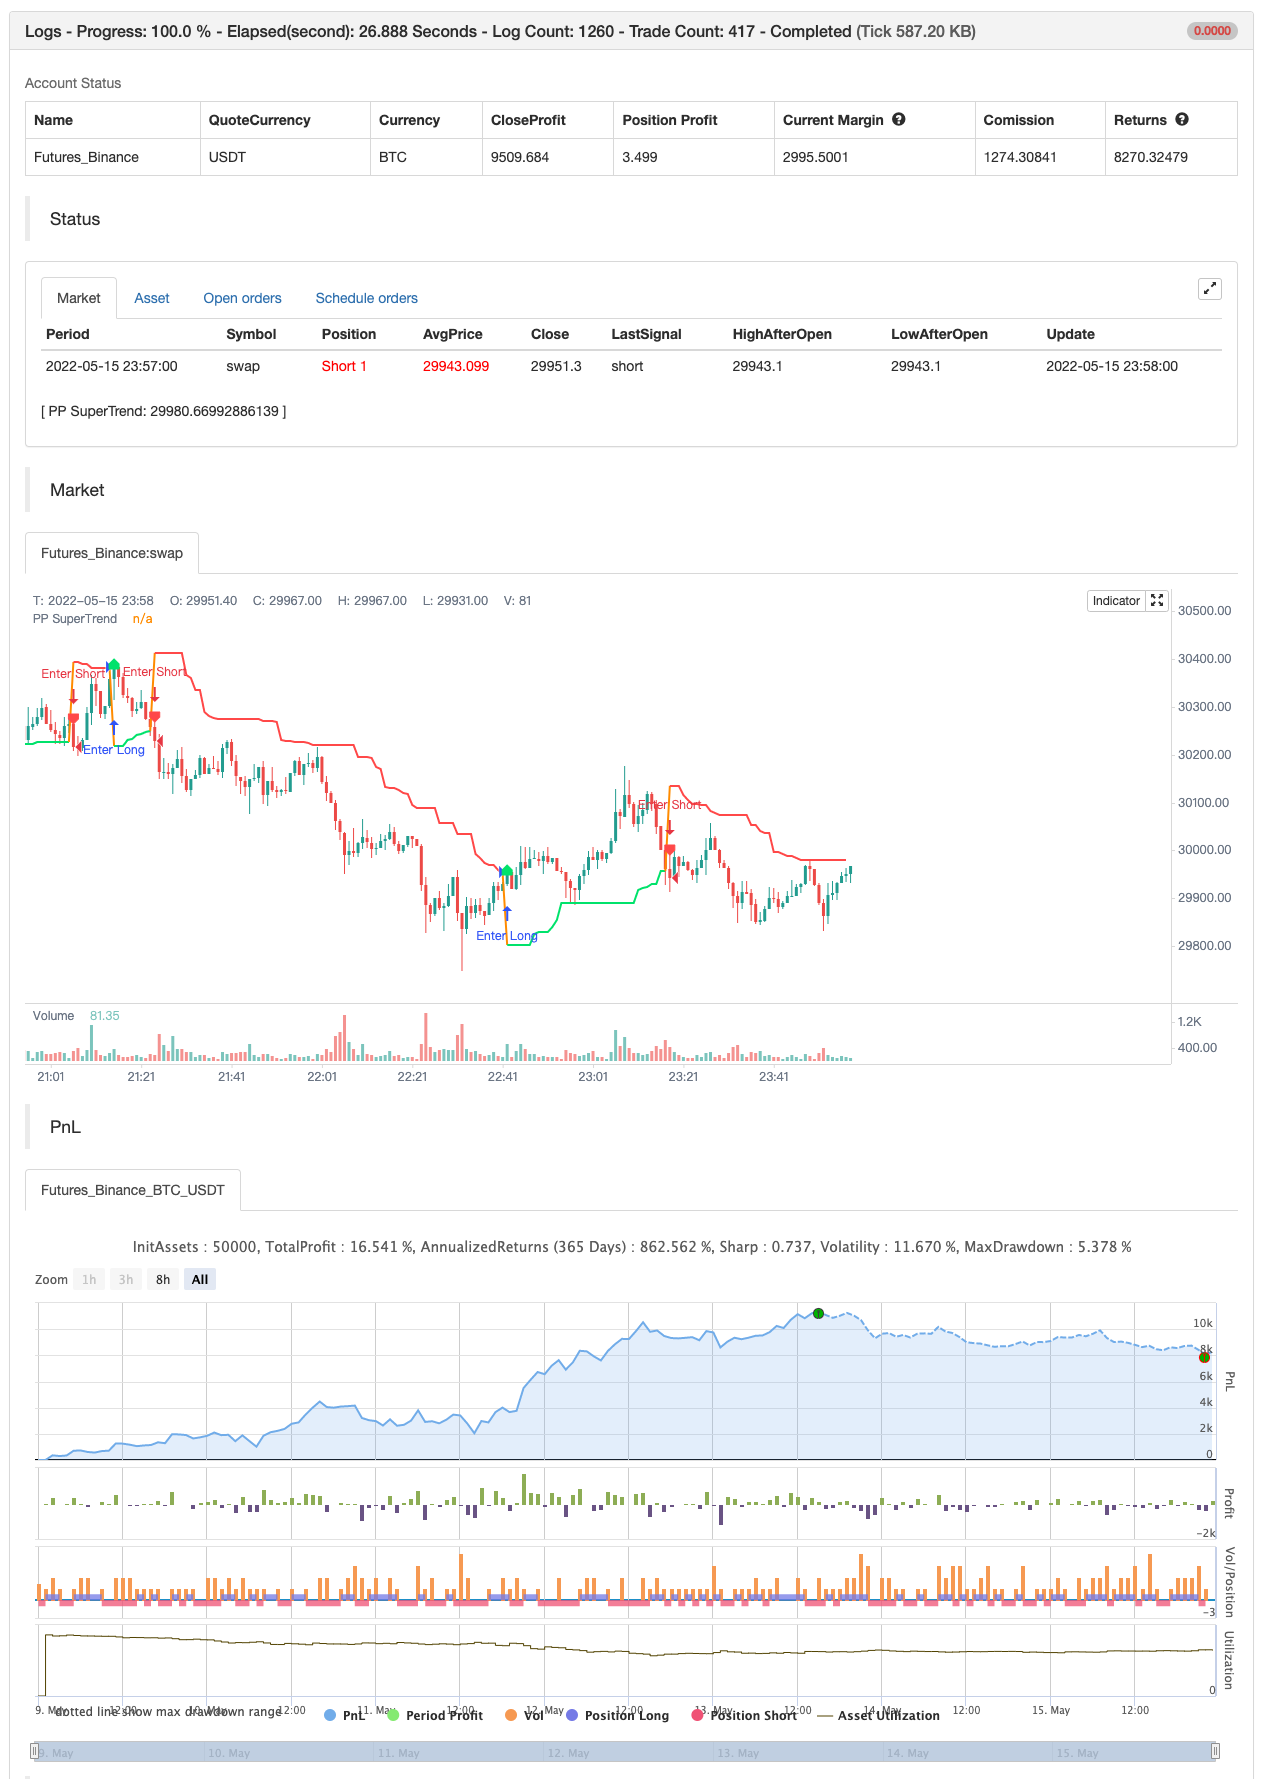
/*backtest
start: 2022-05-09 00:00:00
end: 2022-05-15 23:59:00
period: 1m
basePeriod: 1m
exchanges: [{"eid":"Futures_Binance","currency":"BTC_USDT"}]
*/

// This source code is subject to the terms of the Mozilla Public License 2.0 at https://mozilla.org/MPL/2.0/
// © LonesomeTheBlue

//@version=4
study("Pivot Point SuperTrend", overlay = true)
prd = input(defval = 3, title="Pivot Point Period", minval = 1, maxval = 50)
Factor=input(defval = 2, title = "ATR Factor", minval = 1, step = 0.1)
Pd=input(defval = 6, title = "ATR Period", minval=1)
showpivot = input(defval = false, title="Show Pivot Points")
showlabel = input(defval = true, title="Show Buy/Sell Labels")
showcl = input(defval = false, title="Show PP Center Line")
showsr = input(defval = false, title="Show Support/Resistance")

// get Pivot High/Low
float ph = pivothigh(prd, prd)
float pl = pivotlow(prd, prd)

// drawl Pivot Points if "showpivot" is enabled
plotshape(ph and showpivot, text="H",  style=shape.labeldown, color=na, textcolor=color.red, location=location.abovebar, transp=0, offset = -prd)
plotshape(pl and showpivot, text="L",  style=shape.labeldown, color=na, textcolor=color.lime, location=location.belowbar, transp=0, offset = -prd)

// calculate the Center line using pivot points
var float center = na
float lastpp = ph ? ph : pl ? pl : na
if lastpp
    if na(center)
        center := lastpp
    else
        //weighted calculation
        center := (center * 2 + lastpp) / 3

// upper/lower bands calculation
Up = center - (Factor * atr(Pd))
Dn = center + (Factor * atr(Pd))

// get the trend
float TUp = na
float TDown = na
Trend = 0
TUp := close[1] > TUp[1] ? max(Up, TUp[1]) : Up
TDown := close[1] < TDown[1] ? min(Dn, TDown[1]) : Dn
Trend := close > TDown[1] ? 1: close < TUp[1]? -1: nz(Trend[1], 1)
Trailingsl = Trend == 1 ? TUp : TDown

// plot the trend
linecolor = Trend == 1 and nz(Trend[1]) == 1 ? color.lime : Trend == -1 and nz(Trend[1]) == -1 ? color.red : na
plot(Trailingsl, color = linecolor ,  linewidth = 2, title = "PP SuperTrend")

plot(showcl ? center : na, color = showcl ? center < hl2 ? color.blue : color.red : na)

// check and plot the signals
bsignal = Trend == 1 and Trend[1] == -1
ssignal = Trend == -1 and Trend[1] == 1
plotshape(bsignal and showlabel ? Trailingsl : na, title="Buy", text="Buy", location = location.absolute, style = shape.labelup, size = size.tiny, color = color.lime, textcolor = color.black, transp = 0)
plotshape(ssignal and showlabel ? Trailingsl : na, title="Sell", text="Sell", location = location.absolute, style = shape.labeldown, size = size.tiny, color = color.red, textcolor = color.white, transp = 0)

//get S/R levels using Pivot Points
float resistance = na
float support = na
support := pl ? pl : support[1]
resistance := ph ? ph : resistance[1]

// if enabled then show S/R levels
plot(showsr and support ? support : na, color = showsr and support ? color.lime : na, style = plot.style_circles, offset = -prd)
plot(showsr and resistance ? resistance : na, color = showsr and resistance ? color.red : na, style = plot.style_circles, offset = -prd)

// alerts
alertcondition(Trend == 1 and Trend[1] == -1, title='Buy Signal', message='Buy Signal')
alertcondition(Trend == -1 and Trend[1] == 1, title='Sell Signal', message='Sell Signal')
alertcondition(change(Trend), title='Trend Changed', message='Trend Changed')


if Trend == 1 and Trend[1] == -1
    strategy.entry("Enter Long", strategy.long)
else if Trend == -1 and Trend[1] == 1
    strategy.entry("Enter Short", strategy.short)
সম্পর্কিত
- ভিলা ডায়নামিক পিভট সুপারট্রেন্ড কৌশল
- বিরতি সহ ফিবোনাচি অগ্রগতি
- মাল্টি-গ্রেন দ্বারা বেগেট
- ট্রেলিং স্টপ লস সঙ্গে SUPERTREND ATR
- মিল মেশিন
- চ্যান্ডেলিয়ারের প্রস্থান
- আলফা ট্রেন্ড ব্যবহার
- পিভট অর্ডার ব্লক
- পিভট পয়েন্ট উচ্চ নিম্ন মাল্টি টাইম ফ্রেম
- পিভট ভিত্তিক ট্রেইলিং সর্বোচ্চ ও সর্বনিম্ন
আরো
- রেড কে ভলিউম-এক্সিলারেটেড দিকনির্দেশক শক্তির অনুপাত
- ডোনচিয়ান ব্রেকআউট কোন পুনরায় পেইন্ট
- রেড কে মোমেন্টাম বার
- সুপারজাম্প টার্ন ব্যাক বোলিঞ্জার ব্যান্ড
- ফুকুইজ ট্রেন্ড
- জনির বট
- এসএসএল হাইব্রিড
- চ্যান্ডেলিয়ারের প্রস্থান
- রিসোটো
- ইএমএ ক্লাউড ইনট্রা-ডে স্ট্র্যাটেজি
- সুপারট্রেন্ড+৪চলমান
- গতির উপর ভিত্তি করে ZigZag
- ভিউম্যানচু সিফার বি + ডিভার্জেন্স কৌশল
- কনসেপ্ট ডুয়াল সুপারট্রেন্ড
- সুপার স্কালপার
- ব্যাকটেস্টিং- সূচক
- প্রচলিত
- এসএমএ বিটিসি খুনি
- এমএল সতর্কতা টেমপ্লেট
- বিরতি সহ ফিবোনাচি অগ্রগতি