Drehpunkte Hoch-Niedrig-Multi-Zeitrahmen
Schriftsteller:ChaoZhang, Datum: 2022-05-16 15:12:10Tags:Drehkreuz
Hallo alle,
Es gibt eingebaute und veröffentlichte Pivot Point High Low Indikatoren in der Public Library, aber soweit ich sehe, ist keiner von ihnen für höhere Zeitrahmen. also habe ich beschlossen, dieses Skript zu schreiben und zu veröffentlichen. Ich hoffe, es wäre nützlich, wenn Sie handeln oder Ihre eigenen Skripte entwickeln. Ich habe dies auch getan, um in einem meiner zukünftigen Projekte zu verwenden (wir werden es in ein paar Wochen / Monaten sehen ;)).
Ich habe versucht, alle Einstellungen optional zu machen, damit du mit ihnen spielen kannst, wie du willst.
P.S. Es gibt keinen Kontrollmechanismus, wenn der Chart-Zeitrahmen niedriger ist als der Zeitrahmen in den Optionen.
Genießen Sie es!
Zurückprüfung
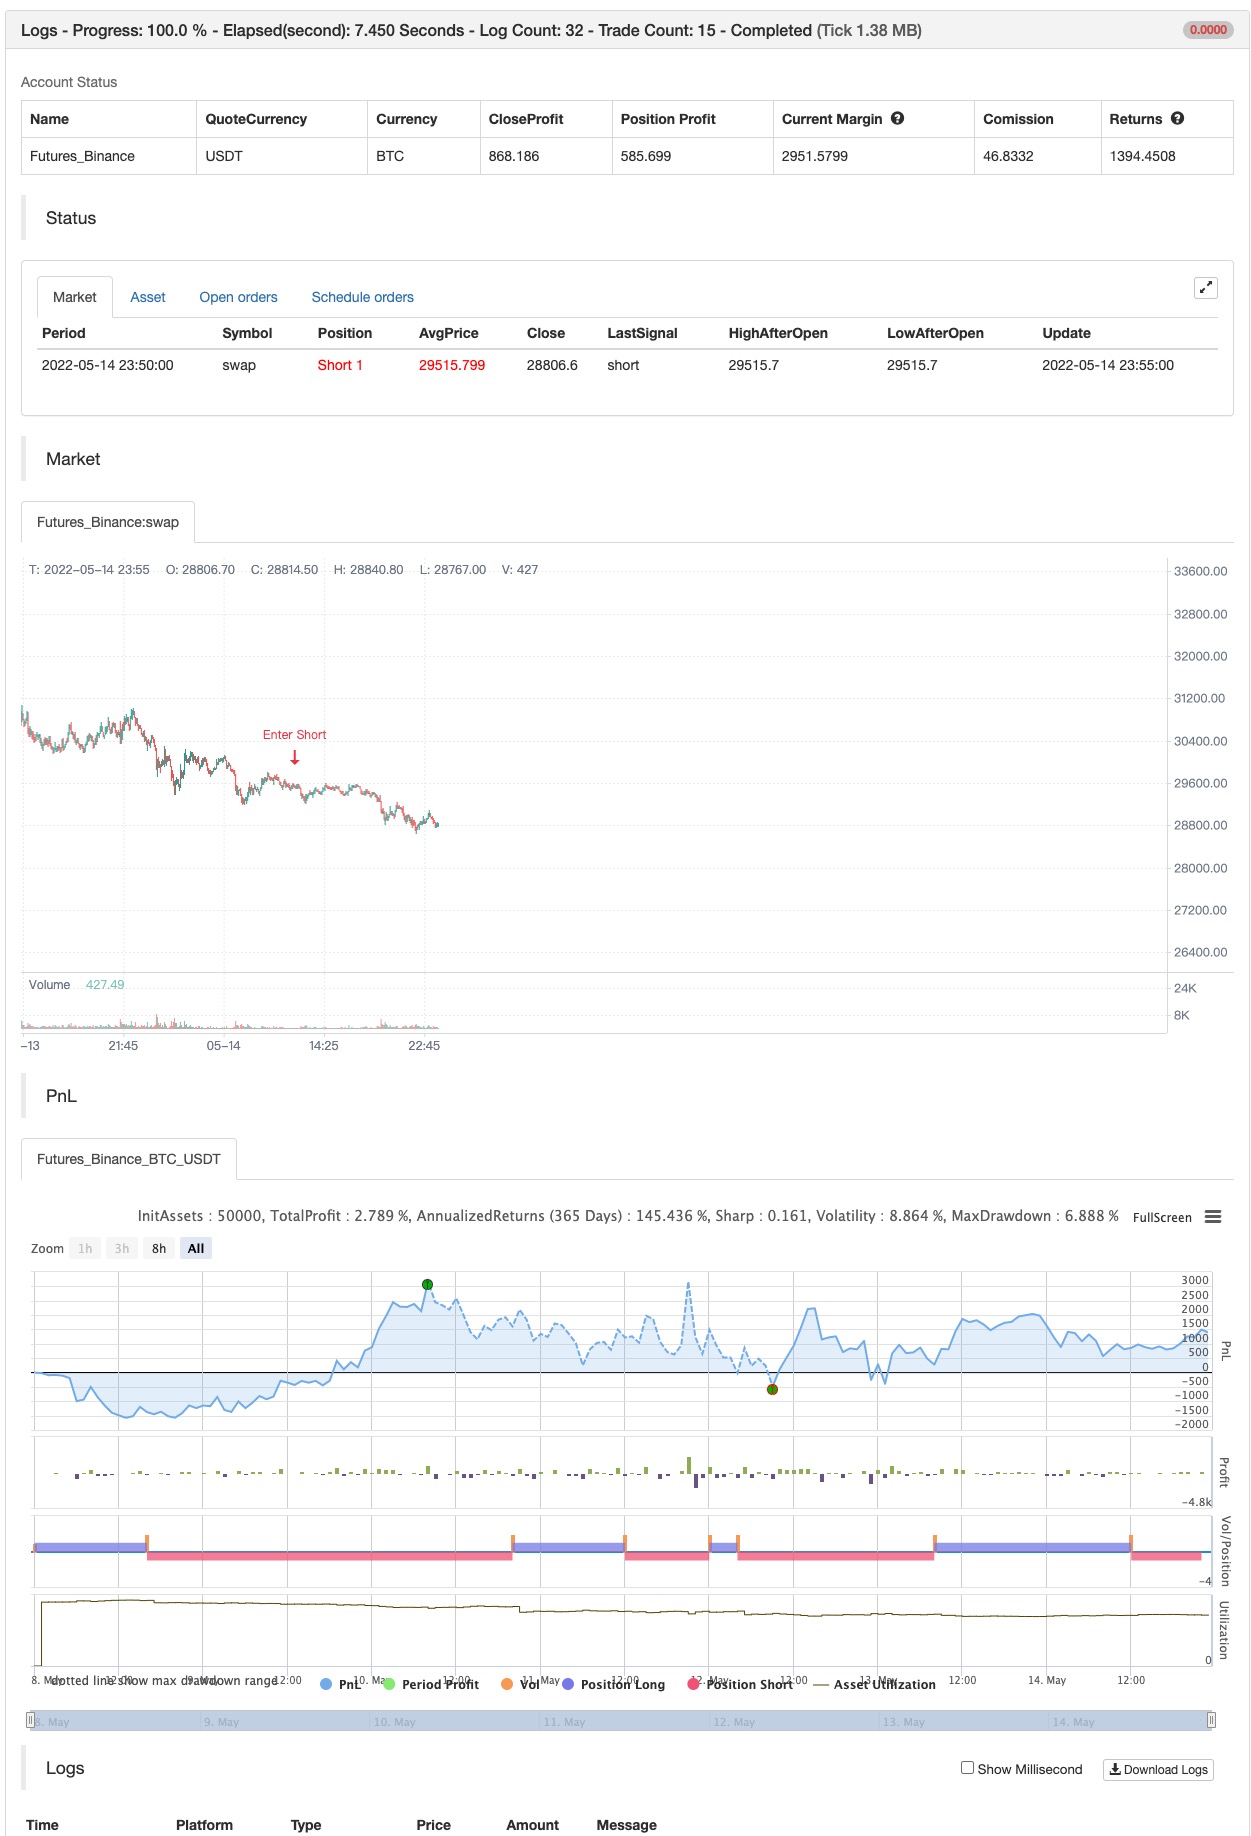
/*backtest
start: 2022-05-08 00:00:00
end: 2022-05-14 23:59:00
period: 5m
basePeriod: 1m
exchanges: [{"eid":"Futures_Binance","currency":"BTC_USDT"}]
*/

// This source code is subject to the terms of the Mozilla Public License 2.0 at https://mozilla.org/MPL/2.0/
// © LonesomeTheBlue

//@version=5
indicator("Pivot Points High Low Multi Time Frame", overlay = true, max_lines_count = 500, max_labels_count = 500)
timeframe = input.timeframe(defval = '240')
leftBars  = input.int(defval = 2, title = "Left Bars", minval = 1)
rightBars  = input.int(defval = 2, title = "Right Bars", minval = 1)
phlinecol = input(defval = color.lime, title = "Pivot High/Low Line Colors", inline = "lc")
pllinecol = input(defval = color.red, title = "", inline = "lc")
phbgcol = input(defval = color.lime, title = "Pivot High BG/Text Colors", inline = "ph")
phtextcol = input(defval = color.black, title = "", inline = "ph")
plbgcol = input(defval = color.red, title = "Pivot Low BG/Text Colors", inline = "pl")
pltextcol = input(defval = color.white, title = "", inline = "pl")

get_phpl()=>
    float ph = ta.pivothigh(leftBars, rightBars)
    float pl = ta.pivotlow(leftBars, rightBars)
    phtimestart = ph ? time[rightBars] : na
    phtimeend = ph ? time[rightBars - 1] : na
    pltimestart = pl ? time[rightBars] : na
    pltimeend = pl ? time[rightBars - 1] : na

    [ph, phtimestart, phtimeend, pl, pltimestart, pltimeend]

// get if there if Pivot High/low and their start/end times
[ph, phtimestart, phtimeend, pl, pltimestart, pltimeend] = request.security(syminfo.tickerid, timeframe, get_phpl(), lookahead = barmerge.lookahead_on)

// keep time of each bars, this is used for lines/labels
var mytime = array.new_int(0)
array.unshift(mytime, time)

// calculate end of the line/time for pivot high/low
bhend = array.get(mytime, math.min(array.indexof(mytime, phtimeend) + 1, array.size(mytime) - 1))
blend = array.get(mytime, math.min(array.indexof(mytime, pltimeend) + 1, array.size(mytime) - 1))

// to draw once
float pivothigh = na(ph[1]) and ph ? ph : na
float pivotlow  = na(pl[1]) and pl ? pl : na


if not na(pivothigh)
    strategy.entry("Enter Long", strategy.long)
else if not na(pivotlow)
    strategy.entry("Enter Short", strategy.short)
Verwandt
- RSI-Divergenzindikator
- Pivot-Trend
- Volumendivergenz
- Pivot-basierte Rücklaufmaxime und -minime
- Supertrend des Drehpunkts
- Villa Dynamic Pivot Supertrend-Strategie
- Pivot-Ordnungsblöcke
- Monatliche Renditen in PineScript-Strategien
Mehr
- Sma-BTC-Killer
- ML-Warnungsvorlage
- Fibonacci-Progression mit Pausen
- RSI MTF Ob+Os
- Fukuiz Octa-EMA + Ichimoku
- MTF Ob+Os der KMU
- Ein intelligenter MACD
- Strategie des OCC R5.1
- Willkommen auf dem Bärenmarkt.
- - Ich weiß.
- Geistertrends verfolgen Strategiedatenbanken
- Geistertrends verfolgen Strategien für die Geschäftsbank
- Geistertrend-Verfolgungsstrategien
- Regenbogen-Oszillator
- Beispiel für die Größe der Aktienkurvenposition
- KLineChart-Demo
- Villa Dynamic Pivot Supertrend-Strategie
- Crodls Supertrend
- RSI von zdmre
- FTL - Bereichsfilter X2 + EMA + UO