Fukuiz-Trend
Schriftsteller:ChaoZhang, Datum: 2022-05-18 10:25:47Tags:RMARSI
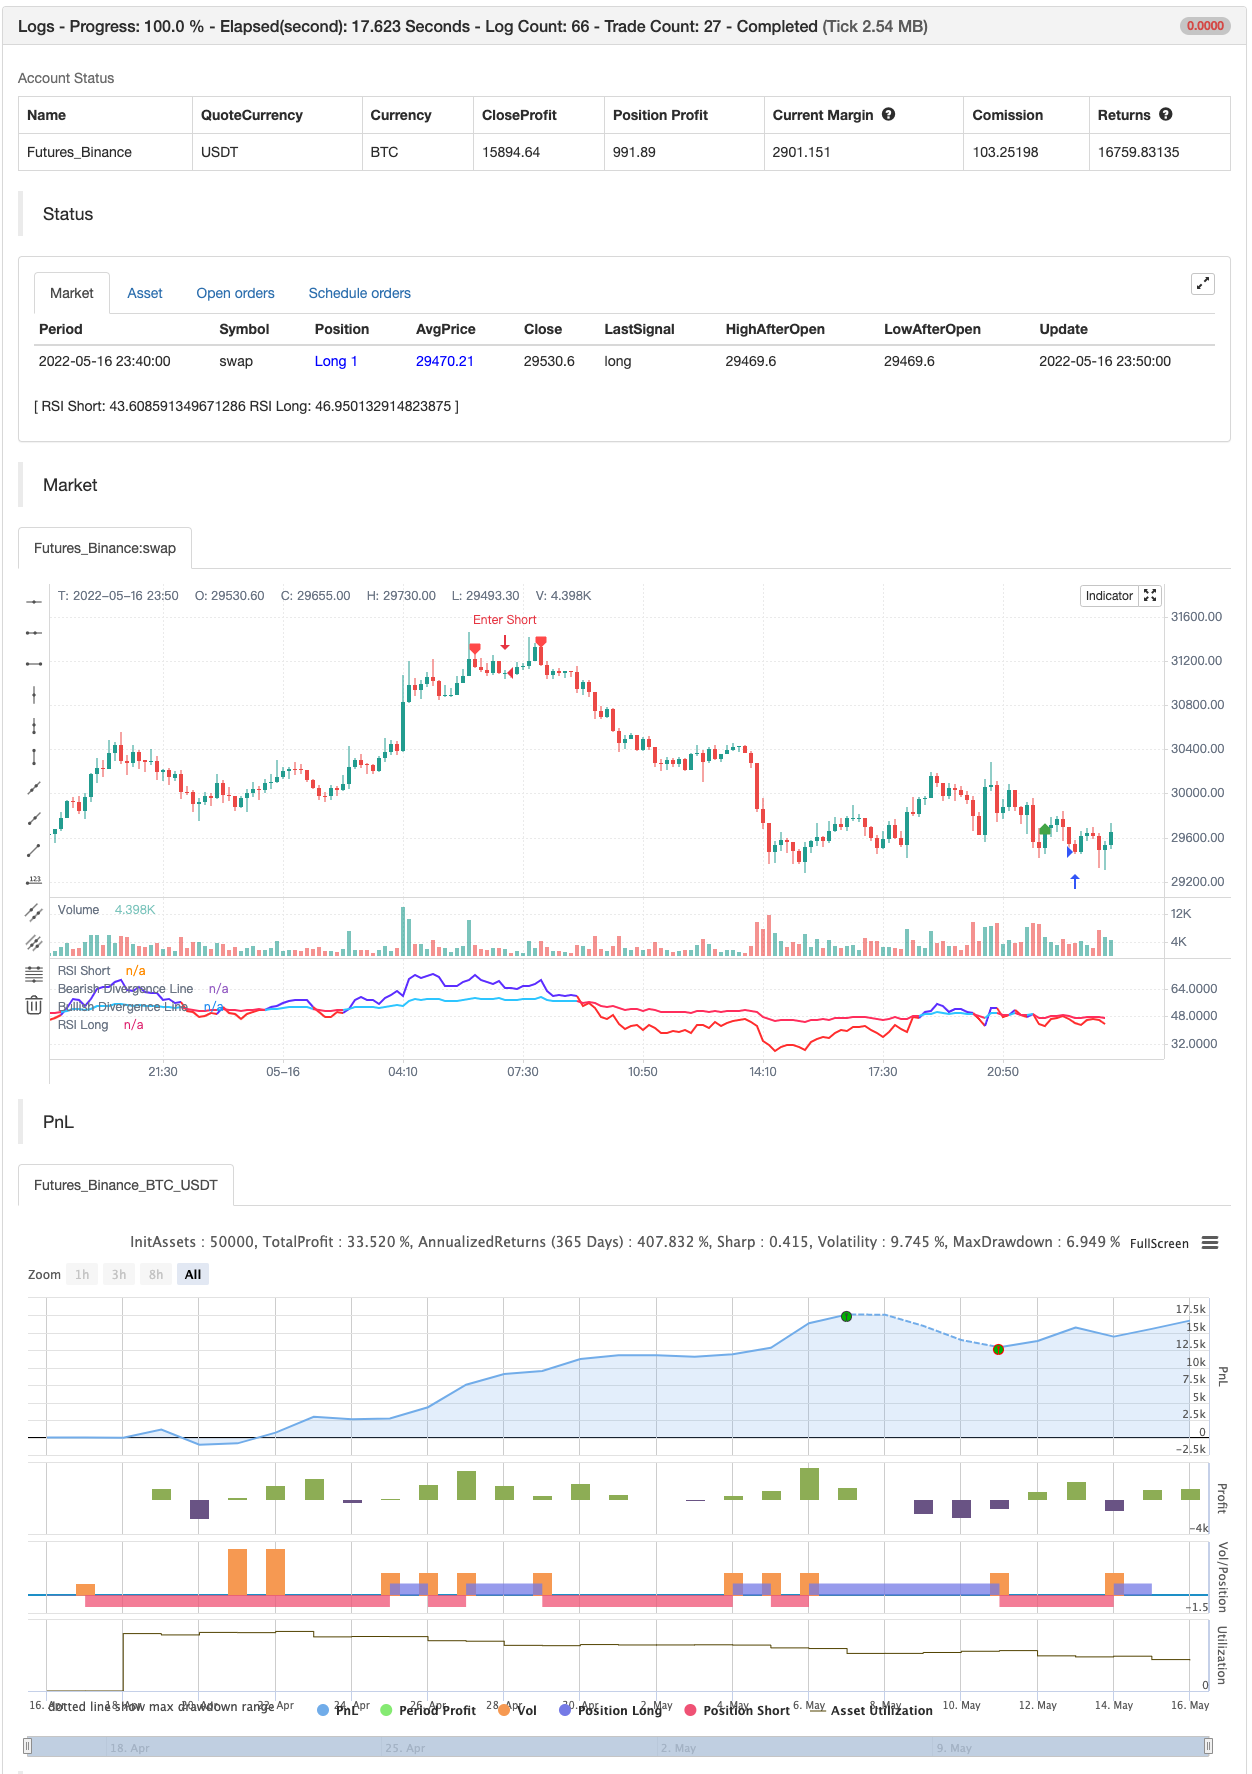
Dieser Indikator basiert auf dem RSI von 2 verschiedenen Perioden.
Eine kurze Einführung in RSI Der Relative Strength Index (RSI) ist ein Momentum-Indikator, der in der technischen Analyse verwendet wird, um die Größe der jüngsten Preisänderungen zu messen, um überkaufte oder überverkaufte Bedingungen im Preis einer Aktie oder eines anderen Vermögenswerts zu bewerten. Der RSI wird als Oszillator (ein Liniendiagramm, das sich zwischen zwei Extremen bewegt) angezeigt und kann eine Messung von 0 bis 100 haben.
Traditionelle Interpretation und Verwendung des RSI ist, dass Werte von 70 oder mehr darauf hindeuten, dass ein Wertpapier überkauft oder überbewertet wird und für eine Trendumkehr oder einen Korrekturrückstoß im Preis vorbereitet werden kann.
In diesem Indikator Ich sehe, dass Sie 2 RSI mit unterschiedlichen Perioden verwenden können, um einen Bullish Trend und einen Bearish Trend vorzuschlagen.
#Bedingungen zwischen kurzen und langen RSI-Kreuzungen# Crossover = Aufwärtstrend (blaue Zone) Crossunder = Bärentrend (rote Zone)
Zurückprüfung
/*backtest
start: 2022-04-17 00:00:00
end: 2022-05-16 23:59:00
period: 10m
basePeriod: 1m
exchanges: [{"eid":"Futures_Binance","currency":"BTC_USDT"}]
*/

//@version=5
//Fukuiz
indicator(title='Fukuiz Trend', shorttitle='Fukuiz Trend', format=format.price, precision=2, timeframe='')

//color//
colorwhite = #FFFFFF
colorblue = #6633FF
colorred = #FF3333
colorblue2 = #33CCFF
colorpink = #FF3366

//Fuction//
len = input.int(24, minval=1, title='RSI Short')
len2 = input.int(100, minval=1, title='RSI Long')
src = input(open, 'Source')
up = ta.rma(math.max(ta.change(src), 0), len)
down = ta.rma(-math.min(ta.change(src), 0), len)
up2 = ta.rma(math.max(ta.change(src), 0), len2)
down2 = ta.rma(-math.min(ta.change(src), 0), len2)
rsi = down == 0 ? 100 : up == 0 ? 0 : 100 - 100 / (1 + up / down)
rsi2 = down2 == 0 ? 100 : up2 == 0 ? 0 : 100 - 100 / (1 + up2 / down2)

Bullish = rsi > rsi2
Bearish = rsi < rsi2
Fukuizcolor = Bullish ? color.new(colorblue,0) : Bearish ? color.new(colorred,0) : na
Fukuizcolor2 = Bullish ? color.new(colorblue2,0) : Bearish ? color.new(colorpink,0) : na
Fukuizcolor3 = Bullish ? color.new(colorblue,75) : Bearish ? color.new(colorred,75) : na

//Plot//
l1 = plot(rsi, 'RSI Short', color=Fukuizcolor, linewidth=2, style=plot.style_line)
l2 = plot(rsi2, 'RSI Long', color=Fukuizcolor2, linewidth=2, style=plot.style_line)
band2 = hline(50, 'Middle Band', color=#FFCC99)
band1 = hline(70, 'Upper Band', color=#FFCC99)
band0 = hline(30, 'Lower Band', color=#FFCC99)
fill(band1, band0, color.new(#0946CA, 90), title='Background')
fill(l1, l2, color=Fukuizcolor3, title='Trend Background')


//DIVERGENCE//
lbR = input(title='Pivot Lookback Right', defval=5)
lbL = input(title='Pivot Lookback Left', defval=5)
rangeUpper = input(title='Max of Lookback Range', defval=60)
rangeLower = input(title='Min of Lookback Range', defval=5)
plotBull = input(title='Bullish Divergence', defval=true)
plotBear = input(title='Bearish Divergence', defval=true)
bearColor = color.red
bullColor = color.green
hiddenBullColor = color.new(color.green, 80)
hiddenBearColor = color.new(color.red, 80)
textColor = color.white
noneColor = color.new(color.white, 100)
osc = ta.rsi(src, len)

plFound = na(ta.pivotlow(osc, lbL, lbR)) ? false : true
phFound = na(ta.pivothigh(osc, lbL, lbR)) ? false : true
_inRange(cond) =>
    bars = ta.barssince(cond == true)
    rangeLower <= bars and bars <= rangeUpper

oscHL = osc[lbR] > ta.valuewhen(plFound, osc[lbR], 1) and _inRange(plFound[1])
priceLL = low[lbR] < ta.valuewhen(plFound, low[lbR], 1)
bullCond = plotBull and priceLL and oscHL and plFound

plot(plFound ? osc[lbR] : na, offset=-lbR, title='Bullish Divergence Line', linewidth=2, color=bullCond ? bullColor : noneColor,display=display.none)

plotshape(bullCond ? osc[lbR] : na, offset=-lbR, title='Bullish Divergence Label', text=' Bull ', style=shape.labelup, location=location.absolute, color=color.new(bullColor, 0), textcolor=color.new(textColor, 0))

oscLH = osc[lbR] < ta.valuewhen(phFound, osc[lbR], 1) and _inRange(phFound[1])
priceHH = high[lbR] > ta.valuewhen(phFound, high[lbR], 1)
bearCond = plotBear and priceHH and oscLH and phFound

plot(phFound ? osc[lbR] : na, offset=-lbR, title='Bearish Divergence Line', linewidth=2, color=bearCond ? bearColor : noneColor,display=display.none)

plotshape(bearCond ? osc[lbR] : na, offset=-lbR, title='Bearish Divergence Label', text=' Bear ', style=shape.labeldown, location=location.absolute, color=color.new(bearColor, 0), textcolor=color.new(textColor, 0))


if bullCond
    strategy.entry("Enter Long", strategy.long)
else if bearCond
    strategy.entry("Enter Short", strategy.short)
- Super Scalper - 5 Minuten 15 Minuten
- Scalping EMA ADX RSI mit Kauf/Verkauf
- RSI - Kauf-Verkaufssignale
- RSI-Statistik-Sortierungsstrategien
- RSI-Relative Strength Index-Strategie
- RSI von zdmre
- RSI MTF Ob+Os
- TMA-Legacy
- SuperTREX
- Bollinger + RSI, Doppelstrategie v1.1
- CM MACD-Anzeiger - Mehrfacher Zeitrahmen - V2
- HODL LINE
- 2 Bewegliche Durchschnittsfarbrichtung
- Scalping PullBack-Tool R1
- Die Kauf- und Verkaufsstrategie hängt von AO+Stoch+RSI+ATR ab.
- EMA-Trend-Wolke
- RedK Volumen-Beschleunigte Richtungsenergie-Verhältnis
- Donchian Breakout keine Ummalung
- RedK-Momentumsbalken
- Superjump-Rückschritt Bollinger-Band
- Johnny's BOT
- SSL-Hybrid
- Lustre-Ausgang
- RISOTTO
- EMA-Intraday-Strategie in der Cloud
- Supertrend des Drehpunkts
- Supertrend+4bewegt
- Momentum-basierte ZigZag
- VuManChu-Chiffer B + Divergenzstrategie
- Konzept Dual SuperTrend