RedK Volumen-Beschleunigte Richtungsenergie-Verhältnis
Schriftsteller:ChaoZhang, Datum: 2022-05-18 15:21:57Tags:EMASMAWMA
Der Volume-Accelerated Directional Energy Ratio (VADER) nutzt Preisbewegungen (Verlagerung) und das zugehörige Volumen (Anstrengung), um die positive (Kauf-) und negative (Verkauf-)
Wie wirkt VADER?
Ich war schon immer ein Fan von technischen Analyse-Konzepten, die einfach sind, und die sowohl Preisaktion als auch Volumen zusammen integrieren - Das Konzept hinter VADER ist wirklich einfach.
Lassen Sie uns durchgehen, um nicht zu technisch zu werden:
Große Preisbewegungen, die mit einem großen Volumen verbunden sind, bedeuten, dass Käufer (wenn der Kurs steigt) oder Verkäufer (wenn der Kurs sinkt) ernsthaft sind und
Die Analogie mit VADER besteht darin, dass wir Preisbewegungen (Veränderung des Schließens zwischen 2 Balken) als Verschiebung (oder Aktionsergebnis) und das zugehörige Volumen als
Wir nehmen dann einen Durchschnitt dieser relativen Energie in jeder Richtung (positiv = Kauf und negativ = Verkauf) und berechnen die Nettoenergie.
Beachten Sie, dass wir die Analogie hier aus einer Handelsperspektive und nicht aus der Physik Perspektive :)
Zurückprüfung
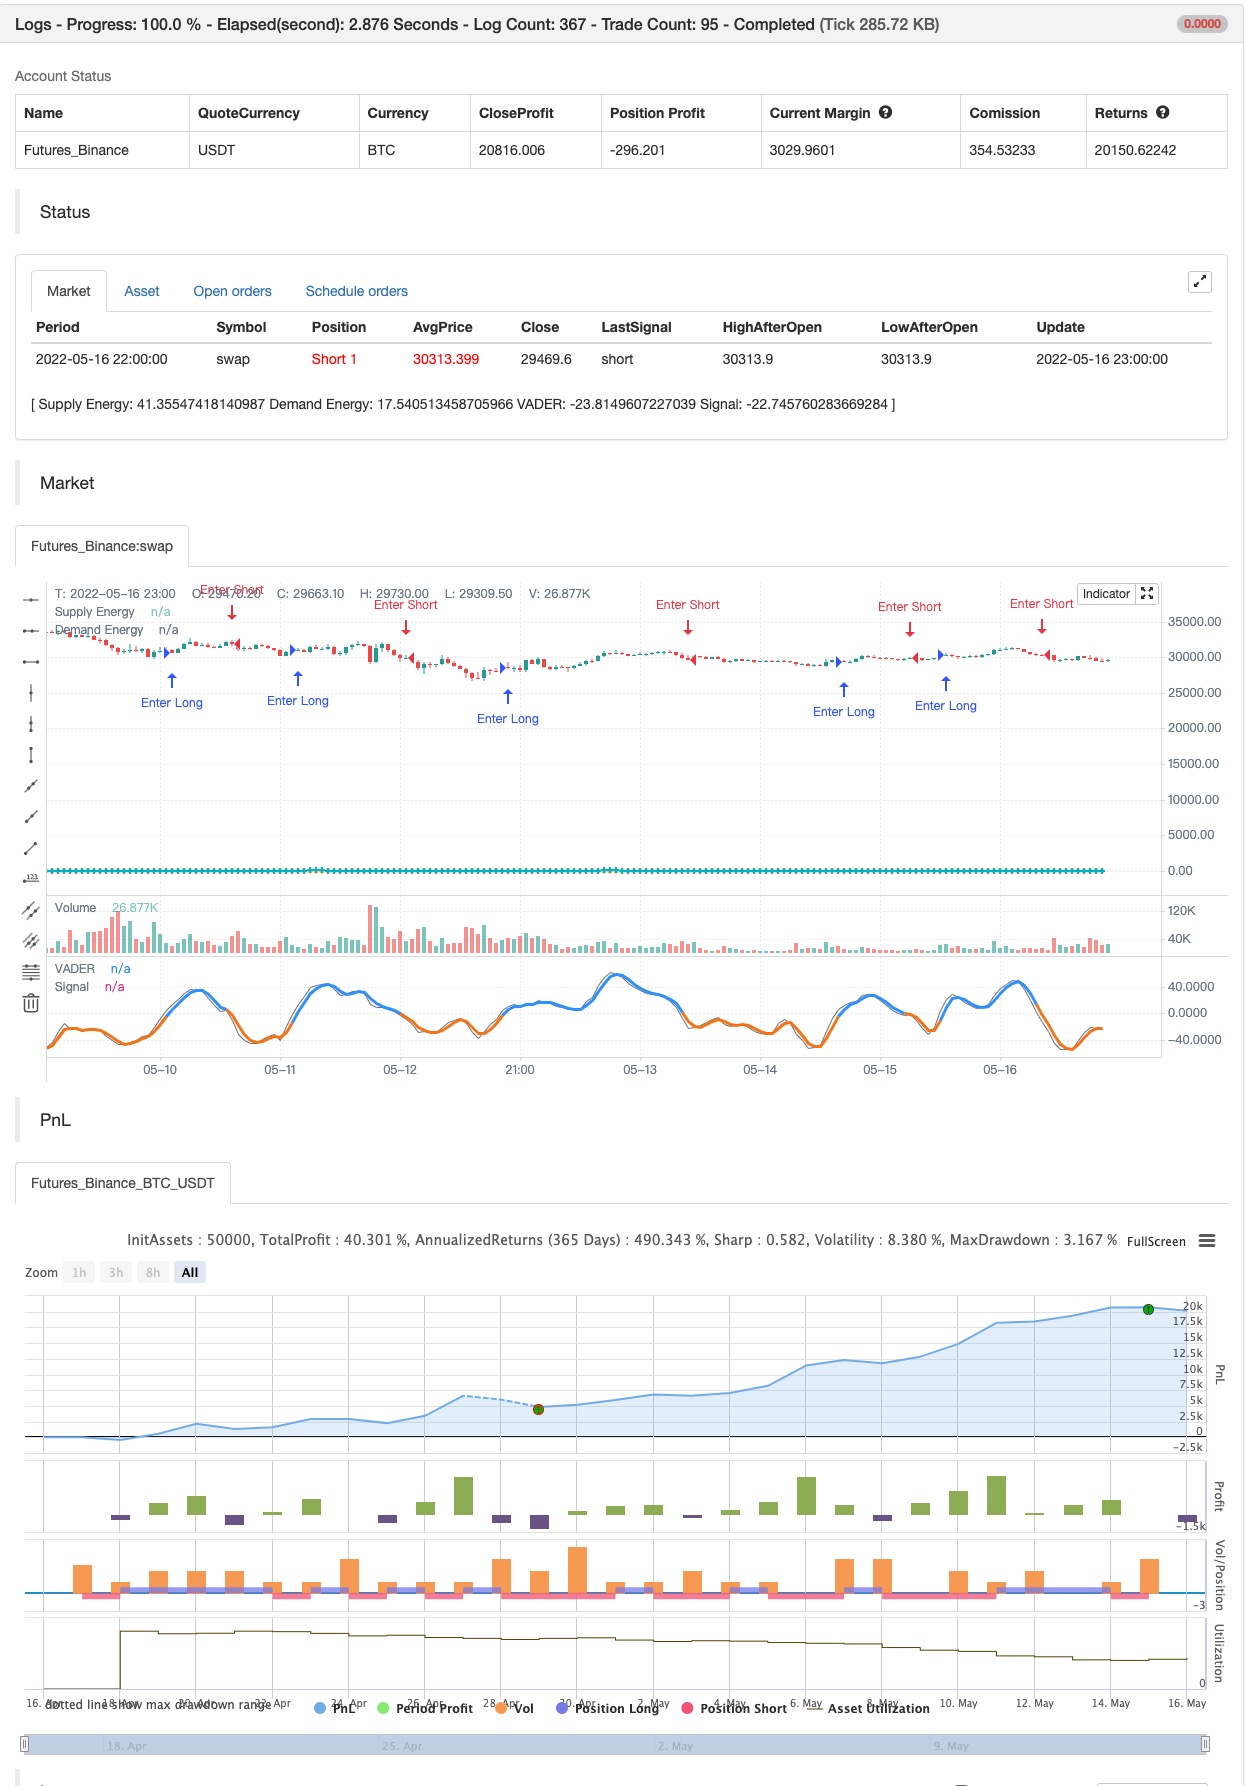
/*backtest
start: 2022-04-17 00:00:00
end: 2022-05-16 23:59:00
period: 1h
basePeriod: 15m
exchanges: [{"eid":"Futures_Binance","currency":"BTC_USDT"}]
*/

// This source code is subject to the terms of the Mozilla Public License 2.0 at https://mozilla.org/MPL/2.0/
// © RedKTrader

//@version=5
indicator('RedK Volume-Accelerated Directional Energy Ratio', 'RedK VADER v3.0', precision=0, timeframe='', timeframe_gaps=false)

// ***********************************************************************************************************
// Choose volume calculation method.. Relative vs full.
// Relative magnifies effect of recent volume spikes (up or down)
f_RelVol(_value, _length) =>
    min_value = ta.lowest(_value, _length)
    max_value = ta.highest(_value, _length)
    ta.stoch(_value, max_value, min_value, _length) / 100
// ***********************************************************************************************************

// ***********************************************************************************************************
// Choose MA type for the base DER calculation ..
// WMA is my preference and is default .. SMA is really slow and lags a lot - but added for comparison
f_derma(_data, _len, MAOption) =>
    value =
      MAOption == 'SMA' ? ta.sma(_data, _len) :
      MAOption == 'EMA' ? ta.ema(_data, _len) :
      ta.wma(_data, _len)
// ***********************************************************************************************************


// ===========================================================================================================
//      Inputs
// ===========================================================================================================

price   = close
length  = input.int(9, minval=1)
DER_avg = input.int(5, 'Average', minval=1, inline='DER', group='Directional Energy Ratio')
MA_Type = input.string('WMA', 'DER MA type', options=['WMA', 'EMA', 'SMA'], inline='DER', group='Directional Energy Ratio')
smooth  = input.int(3, 'Smooth', minval=1,  inline='DER_1', group='Directional Energy Ratio')

show_senti = input.bool(false, 'Sentiment',  inline='DER_s', group='Directional Energy Ratio')
senti   = input.int(20, 'Length', minval=1, inline='DER_s', group='Directional Energy Ratio')


v_calc  = input.string('Relative', 'Calculation', options=['Relative', 'Full', 'None'], group='Volume Parameters')
vlookbk = input.int(10, 'Lookback (for Relative)', minval=1,                            group='Volume Parameters')

// ===========================================================================================================
//          Calculations
// ===========================================================================================================

// Volume Calculation Option  -- will revert to no volume acceleration for instruments with no volume data
vola    =
  v_calc == 'None' or na(volume) ? 1 :
  v_calc == 'Relative' ? f_RelVol(volume, vlookbk) :
  volume

R       = (ta.highest(2) - ta.lowest(2)) / 2                    // R is the 2-bar average bar range - this method accomodates bar gaps
sr      = ta.change(price) / R                                  // calc ratio of change to R
rsr     = math.max(math.min(sr, 1), -1)                         // ensure ratio is restricted to +1/-1 in case of big moves
c       = fixnan(rsr * vola)                                    // add volume accel -- fixnan adresses cases where no price change between bars

c_plus  = math.max(c, 0)                                        // calc directional vol-accel energy
c_minus = -math.min(c, 0)

// plot(c_plus)
// plot(c_minus)


avg_vola    = f_derma(vola, length, MA_Type)
dem         = f_derma(c_plus, length, MA_Type)  / avg_vola          // directional energy ratio
sup         = f_derma(c_minus, length, MA_Type) / avg_vola

adp         = 100 * ta.wma(dem, DER_avg)                            // average DER
asp         = 100 * ta.wma(sup, DER_avg)
anp         = adp - asp                                             // net DER..
anp_s       = ta.wma(anp, smooth)

// Calculate Sentiment - a VADER for a longer period and can act as a baseline (compared to a static 0 value)
// note we're not re-calculating vol_avg, demand or supply energy for sentiment. this would've been a different approach
s_adp       = 100 * ta.wma(dem, senti)                            // average DER for sentiment length
s_asp       = 100 * ta.wma(sup, senti)
V_senti     = ta.wma(s_adp - s_asp, smooth)


// ===========================================================================================================
//      Colors & plots
// ===========================================================================================================
c_adp   = color.new(color.aqua, 30)
c_asp   = color.new(color.orange, 30)
c_fd    = color.new(color.green, 80)
c_fs    = color.new(color.red, 80)
c_zero  = color.new(#ffee00, 70)

c_up    = color.new(#359bfc, 0)
c_dn    = color.new(#f57f17, 0)

c_sup   = color.new(#33ff00, 80)
c_sdn   = color.new(#ff1111, 80)
up      = anp_s >= 0
s_up    = V_senti >=0

hline(0, 'Zero Line', c_zero, hline.style_solid)

// =============================================================================
// v3.0 --- Sentiment will be represented as a 4-color histogram
c_grow_above = #1b5e2080
c_grow_below = #dc4c4a80
c_fall_above = #66bb6a80
c_fall_below = #ef8e9880

sflag_up = math.abs(V_senti) >= math.abs(V_senti[1])

plot(show_senti ? V_senti : na, "Sentiment", style=plot.style_columns,
 color = s_up ? (sflag_up ? c_grow_above : c_fall_above) :
 sflag_up ? c_grow_below : c_fall_below)
// =============================================================================

s = plot(asp, 'Supply Energy', c_asp, 2, style=plot.style_circles,  join=true)
d = plot(adp, 'Demand Energy', c_adp, 2, style=plot.style_cross,    join=true)
fill(d, s, adp > asp ? c_fd : c_fs)

plot(anp, 'VADER', color.new(color.gray, 30), display=display.none)
plot(anp_s, 'Signal', up ? c_up : c_dn, 3)

// ===========================================================================================================
//      v2.0 adding alerts
// ===========================================================================================================

Alert_up    = ta.crossover(anp_s,0)
Alert_dn    = ta.crossunder(anp_s,0)
Alert_swing = ta.cross(anp_s,0)

// "." in alert title for the alerts to show in the right order up/down/swing
alertcondition(Alert_up,    ".   VADER Crossing 0 Up",      "VADER Up - Buying Energy Detected!")
alertcondition(Alert_dn,    "..  VADER Crossing 0 Down",    "VADER Down - Selling Energy Detected!")
alertcondition(Alert_swing, "... VADER Crossing 0",         "VADER Swing - Possible Reversal")

// ===========================================================================================================
//      v3.0 more alerts for VADER crossing Sentiment
// ===========================================================================================================

v_speedup = ta.crossover(anp_s, V_senti)
v_slowdn  = ta.crossunder(anp_s, V_senti)
alertcondition(v_speedup,   "*  VADER Speeding Up",      "VADER Speeding Up!")
alertcondition(v_slowdn,    "** VADER Slowing Down",    "VADER Slowing Down!")


if Alert_up
    strategy.entry("Enter Long", strategy.long)
else if Alert_dn
    strategy.entry("Enter Short", strategy.short)
- RedK Dual VADER mit Energiestangen
- Quantitative Handelsstrategie auf der Grundlage gleitender Durchschnitte und Bollinger-Bänder
- Beweglicher Durchschnittsquerschnitt, mehrjährig (MTF)
- HALFTREND + HEMA + SMA (Falschsignal-Strategie)
- Regenbogen-Oszillator
- RedK-Momentumsbalken
- ESSMA
- Super Scalper
- Superjump-Rückschritt Bollinger-Band
- Ein intelligenter MACD
- Bestellblock-Finder
- TrendScalp-FractalBox-3EMA ist ein
- QQE-Signale
- U-Bit-Gitterspannungsfilter
- CM MACD-Anzeiger - Mehrfacher Zeitrahmen - V2
- HODL LINE
- 2 Bewegliche Durchschnittsfarbrichtung
- Scalping PullBack-Tool R1
- Die Kauf- und Verkaufsstrategie hängt von AO+Stoch+RSI+ATR ab.
- EMA-Trend-Wolke
- Donchian Breakout keine Ummalung
- RedK-Momentumsbalken
- Superjump-Rückschritt Bollinger-Band
- Fukuiz-Trend
- Johnny's BOT
- SSL-Hybrid
- Lustre-Ausgang
- RISOTTO
- EMA-Intraday-Strategie in der Cloud
- Supertrend des Drehpunkts