RedK Dual VADER mit Energiestangen
Schriftsteller:ChaoZhang, Datum: 2022-05-24 11:49:07Tags:SMAEMAWMA
Die visuellen Verbesserungen, die ich in VADER-DEB hinzugefügt habe, helfen, mehr Einblicke in die
- Ausstellung der doppelten / langen VADER-Grafik standardmäßig (die wir als Stellvertreter für die Stimmung verwenden) - und es zeigt sich jetzt als ein Bereich (anstatt eines Histogramms) - Sie können immer noch die Stimmung Grafik in Indikator-Einstellungen zu verstecken und
- Durch die Verwendung von Richtungen
Energiebalken (anstelle von Energielinien in Version 3.0) sind optionale rote/grüne DER-Linien in den Studieneinstellungen verfügbar und werden standardmäßig versteckt.
Das ist also Dual VADER w/Energy Bars
Diese Änderungen mögen von manchen als klein angesehen werden, aber meiner Meinung nach fanden ich sie visuell ansprechender und besser für
Die Kernberechnung im Code ändert sich nicht, wie die obige Grafik zeigt, in der wir beide VADER-Versionen nebeneinander vergleichen.
Wenn Sie mit der VADER-Version 3.0 zufrieden sind, können Sie sie weiterhin verwenden.
Viel Glück!
Zurückprüfung
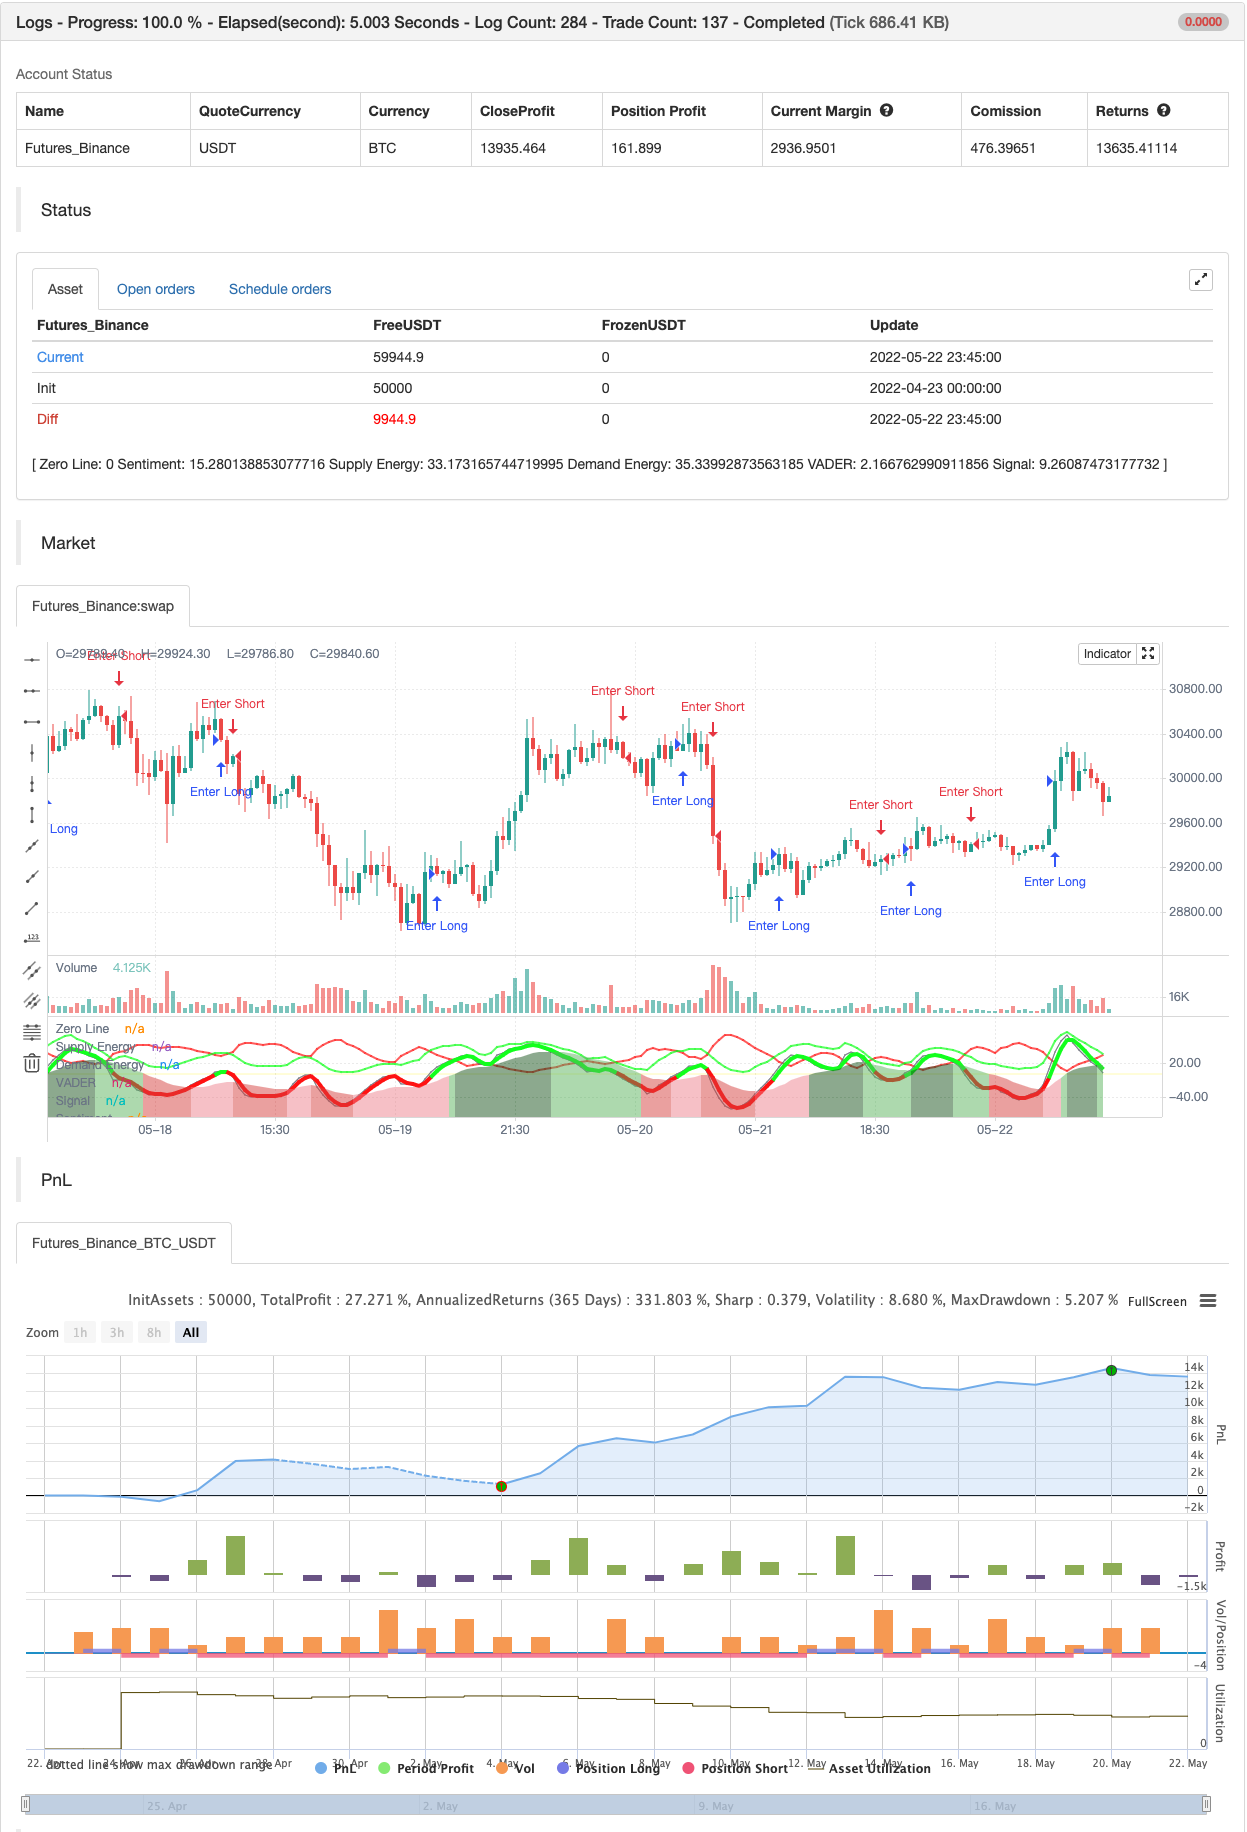
/*backtest
start: 2022-04-23 00:00:00
end: 2022-05-22 23:59:00
period: 45m
basePeriod: 5m
exchanges: [{"eid":"Futures_Binance","currency":"BTC_USDT"}]
*/

// This source code is subject to the terms of the Mozilla Public License 2.0 at https://mozilla.org/MPL/2.0/
// © RedKTrader

//@version=5
indicator('RedK Dual VADER with Energy Bars [VADER-DEB]', 'RedK VADER-DEB v4.0', precision=0, timeframe='', timeframe_gaps=false)

// This version is the same as VADER v3.0 with enhanced visuals, using Energy Bars instead of the positive/energy lines
// Sentiment plot changed from histogram to area and is exposed by default (hence Dual w/ Energy Bars -- DEB)
// No change in core calculations from VADER v3.0  -- and that's why i'll just call it VADER v4.0

// ***********************************************************************************************************
// Choose volume calculation method.. Relative vs full.
// Relative magnifies effect of recent volume spikes (up or down)
f_RelVol(_value, _length) =>
    min_value = ta.lowest(_value, _length)
    max_value = ta.highest(_value, _length)
    ta.stoch(_value, max_value, min_value, _length) / 100
// ***********************************************************************************************************

// ***********************************************************************************************************
// Choose MA type for the base DER calculation ..
// WMA is my preference and is default .. SMA is really slow and lags a lot - but added for comparison
f_derma(_data, _len, MAOption) =>
    value =
      MAOption == 'SMA' ? ta.sma(_data, _len) :
      MAOption == 'EMA' ? ta.ema(_data, _len) :
      ta.wma(_data, _len)
// ***********************************************************************************************************


// ===========================================================================================================
//      Inputs
// ===========================================================================================================

price   = close
length  = input.int(10, minval=1)
DER_avg = input.int(5, 'Average', minval=1, inline='DER', group='Directional Energy Ratio')
MA_Type = input.string('WMA', 'DER MA type', options=['WMA', 'EMA', 'SMA'], inline='DER', group='Directional Energy Ratio')
smooth  = input.int(3, 'Smooth', minval=1,  inline='DER_1', group='Directional Energy Ratio')

show_senti = input.bool(true, 'Sentiment',  inline='DER_s', group='Directional Energy Ratio')
senti   = input.int(20, 'Length', minval=1, inline='DER_s', group='Directional Energy Ratio')


v_calc  = input.string('Relative', 'Calculation', options=['Relative', 'Full', 'None'], group='Volume Parameters')
vlookbk = input.int(20, 'Lookback (for Relative)', minval=1,                            group='Volume Parameters')

// ===========================================================================================================
//          Calculations
// ===========================================================================================================

// Volume Calculation Option  -- will revert to no volume acceleration for instruments with no volume data
vola    =
  v_calc == 'None' or na(volume) ? 1 :
  v_calc == 'Relative' ? f_RelVol(volume, vlookbk) :
  volume

R       = (ta.highest(2) - ta.lowest(2)) / 2                    // R is the 2-bar average bar range - this method accomodates bar gaps
sr      = ta.change(price) / R                                  // calc ratio of change to R
rsr     = math.max(math.min(sr, 1), -1)                         // ensure ratio is restricted to +1/-1 in case of big moves
c       = fixnan(rsr * vola)                                    // add volume accel -- fixnan adresses cases where no price change between bars

c_plus  = math.max(c, 0)                                        // calc directional vol-accel energy
c_minus = -math.min(c, 0)

// plot(c_plus)
// plot(c_minus)


avg_vola    = f_derma(vola, length, MA_Type)
dem         = f_derma(c_plus, length, MA_Type)  / avg_vola          // directional energy ratio
sup         = f_derma(c_minus, length, MA_Type) / avg_vola

adp         = 100 * ta.wma(dem, DER_avg)                            // average DER
asp         = 100 * ta.wma(sup, DER_avg)
anp         = adp - asp                                             // net DER..
anp_s       = ta.wma(anp, smooth)

// Calculate Sentiment - a VADER for a longer period and can act as a baseline (compared to a static 0 value)
// note we're not re-calculating vol_avg, demand or supply energy for sentiment. this would've been a different approach
s_adp       = 100 * ta.wma(dem, senti)                            // average DER for sentiment length
s_asp       = 100 * ta.wma(sup, senti)
V_senti     = ta.wma(s_adp - s_asp, smooth)


// ===========================================================================================================
//      Colors & plots
// ===========================================================================================================
c_adp   = color.new(#11ff20, 30)
c_asp   = color.new(#ff1111, 30)
c_fd    = color.new(color.green, 80)
c_fs    = color.new(color.red, 80)
c_zero  = color.new(#ffee00, 70)

c_up    = color.new(#11ff20, 0)
c_dn    = color.new(#ff1111, 0)

up      = anp_s >= 0
s_up    = V_senti >=0

hline(0, 'Zero Line', c_zero, hline.style_solid)

// =============================================================================
// v4.0 --- Sentiment will be represented as a 4-color area graph
c_grow_above = #1b5e2080
c_grow_below = #dc4c4a80
c_fall_above = #66bb6a80
c_fall_below = #ef8e9880

sflag_up = math.abs(V_senti) >= math.abs(V_senti[1])

plot(show_senti ? V_senti : na, "Sentiment", style=plot.style_area,
 color = s_up ? (sflag_up ? c_grow_above : c_fall_above) :
 sflag_up ? c_grow_below : c_fall_below)

// ===========================================================================================================
//      v4.0 Use Energy Bars instead of DER lines
// ===========================================================================================================

// Prep the Energy Bars
bo = asp
bc = adp
bh = math.max(bo, bc)
bl = math.min(bo, bc)

rising      = ta.change(bc) > 0

c_barup     = #11ff2088
c_bardn     = #ff111188
c_bardj     = #ffffff88

barcolor    = bc > bo and rising ? c_barup : bc < bo and not rising ? c_bardn : c_bardj
//plotcandle(bo, bh, bl, bc, 'Energy Bars', barcolor, barcolor, bordercolor = barcolor)

// ============================================================================================================

s = plot(asp, 'Supply Energy', c_asp, 2, display = display.none)
d = plot(adp, 'Demand Energy', c_adp, 2, display = display.none)

plot(anp, 'VADER', color.new(color.gray, 30), display=display.none)
plot(anp_s, 'Signal', up ? c_up : c_dn, 4)

// ===========================================================================================================
//      v2.0 adding alerts
// ===========================================================================================================

Alert_up    = ta.crossover(anp_s,0)
Alert_dn    = ta.crossunder(anp_s,0)
Alert_swing = ta.cross(anp_s,0)

// "." in alert title for the alerts to show in the right order up/down/swing
alertcondition(Alert_up,    ".   VADER Crossing 0 Up",      "VADER Up - Buying Energy Detected!")
alertcondition(Alert_dn,    "..  VADER Crossing 0 Down",    "VADER Down - Selling Energy Detected!")
alertcondition(Alert_swing, "... VADER Crossing 0",         "VADER Swing - Possible Reversal")

// ===========================================================================================================
//      v3.0 more alerts for VADER crossing Sentiment
// ===========================================================================================================

v_speedup = ta.crossover(anp_s, V_senti)
v_slowdn  = ta.crossunder(anp_s, V_senti)
alertcondition(v_speedup,   "*  VADER Speeding Up",      "VADER Speeding Up!")
alertcondition(v_slowdn,    "** VADER Slowing Down",    "VADER Slowing Down!")


if Alert_up
    strategy.entry("Enter Long", strategy.long)
else if Alert_dn
    strategy.entry("Enter Short", strategy.short)
- Quantitative Handelsstrategie auf der Grundlage gleitender Durchschnitte und Bollinger-Bänder
- Beweglicher Durchschnittsquerschnitt, mehrjährig (MTF)
- HALFTREND + HEMA + SMA (Falschsignal-Strategie)
- RedK Volumen-Beschleunigte Richtungsenergie-Verhältnis
- Regenbogen-Oszillator
- RedK-Momentumsbalken
- ESSMA
- Super Scalper
- Superjump-Rückschritt Bollinger-Band
- Ein intelligenter MACD
- BESTE Verschlucken + Ausbruchstrategie
- Bollinger Awesome Warnung R1
- Plug-ins für mehrere Börsen
- Triangle-Leistungen (Leistungen für kleine Währungen mit unterschiedlichen Marktpreisen)
- bybit umgekehrt vertraglich dynamisches Gitter (spezifisches Gitter)
- TradingView-Warnungen für MT4 MT5 + dynamische Variablen
- Matrixreihe
- Super Scalper - 5 Minuten 15 Minuten
- Relativer Stärkeindex - Divergenzen - Freiheit
- Lineare Regression ++
- Konsolidierungszonen - Live
- Quantitative Qualitative Schätzung
- Beweglicher Durchschnittsquerschnitt, mehrjährig (MTF)
- MACD-Reloaded-Strategie
- Supertrended gleitende Durchschnitte
- Handel mit ABC
- 15min BTCUSDTPERP BOT
- Shannon-Entropie V2
- Supertrend mit dem Trailing-Stopp-Verlust
- Volumenfluss v3