2.7 Use of indicators
Author: The Little Dream, Created: 2016-11-10 16:19:36, Updated: 2019-08-01 09:25:06Use of indicators
-
TA - Optimized partial rewrite of common indicator libraries
TA 指标库
MACD       指数平滑异同平均线
KDJ        随机指标
RSI        强弱指标
ATR        平均真实波幅
OBV        能量潮
MA         移动平均线
EMA        指数平均数指标
BOLL       布林带
Alligator  Alligator Indicator
CMF        蔡金货币流量指标
Highest    周期最高价
Lowest     周期最低价
Let's try to write a test with MACD indicator, before we open the MACD label in the API documentation and see the specific description.
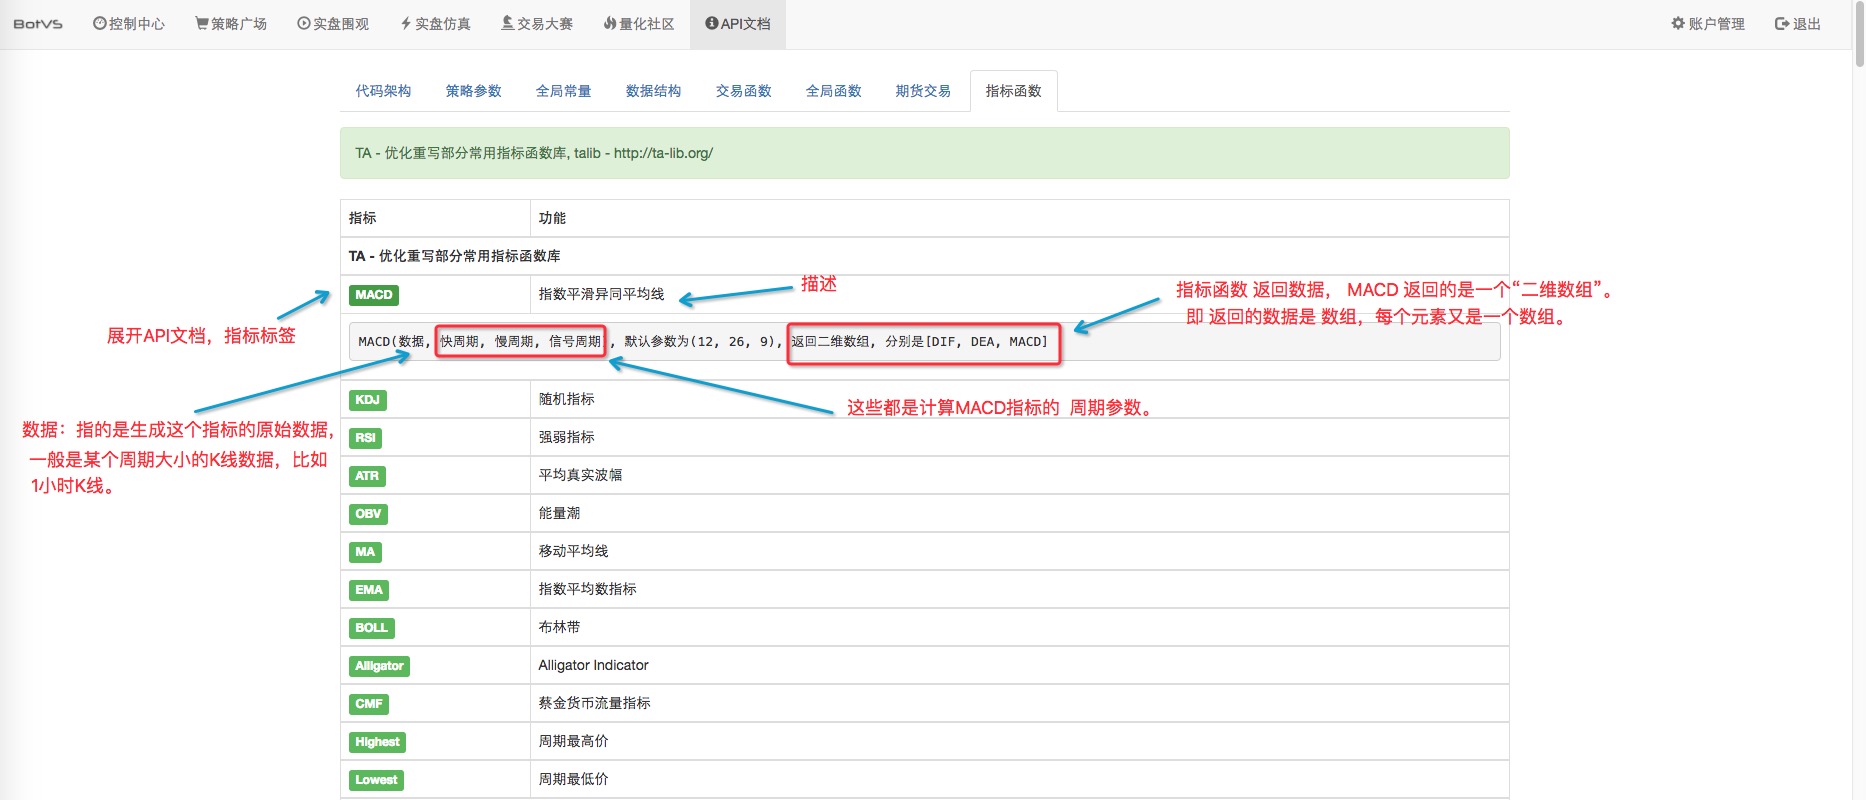
If you are interested in DIF, DEA, indicator algorithms, etc., you can go to Baidu and search for MACD algorithms, there are many resources, well-packaged interfaces, we have them ready to use.
function main(){
    var records = null;
    var macd = null;
    while(true){
        records = _C(exchange.GetRecords);  // 获取K线数据 ,默认为策略界面设置的K线周期, _C 是一个容错的内置函数。
                                            // _C 详见 https://www.fmz.com/bbs-topic/320  问题7。
        macd = TA.MACD(records);   // 不加参数的话,使用的是默认参数  12, 26, 9
        Log("macd[0]", macd[0]);   // DIF
        Log("macd[1]", macd[1]);   // DEA
        Log("macd[2]", macd[2]);   // MACD
        Log("macd[0]长度", macd[0].length);   // DIF 长度
        Log("macd[1]长度", macd[1].length);   // DEA 长度
        Log("macd[2]长度", macd[2].length);   // MACD 长度
        Log("records 长度:", records.length);  // 显示一下 records 的长度。
        Sleep(1000 * 60 * 5);
    }
}
The results of the analogue test:
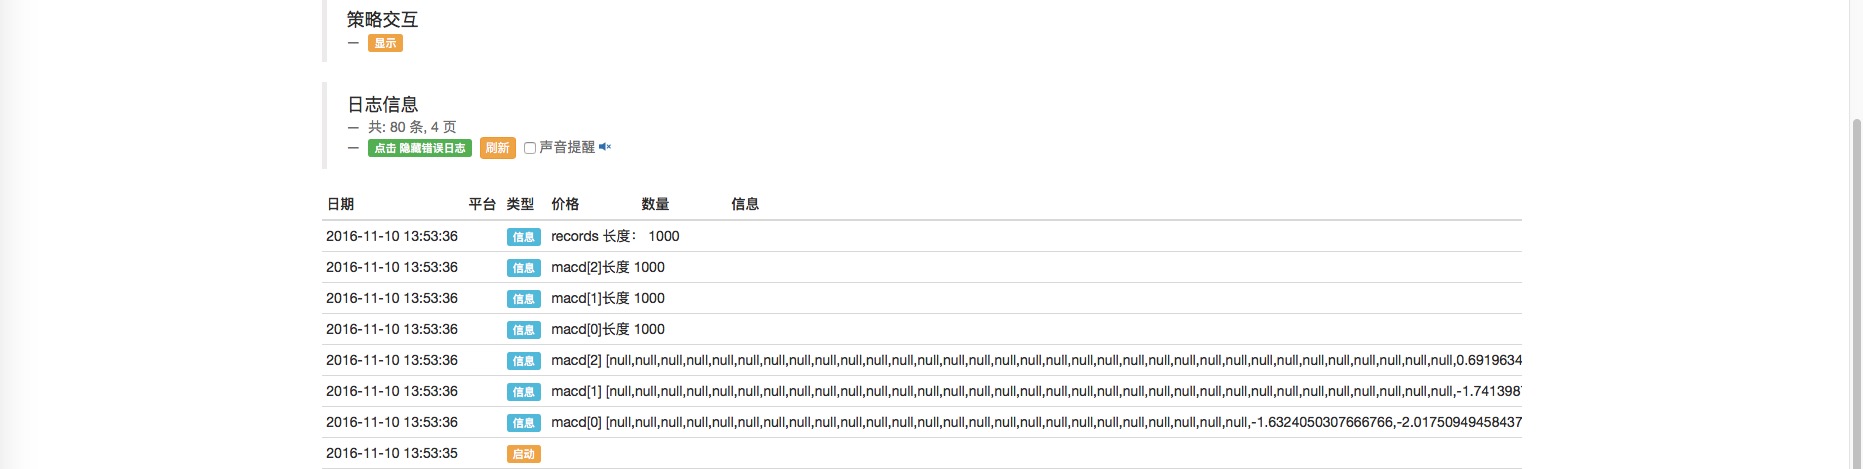
As you can see, all of the calculated indicators are null at the beginning, and the data that follows has a specific value, because the calculation cycle specified by the indicator parameter cannot be calculated until the data volume (records data) does not meet this cycle. Therefore, it is important to understand the description of the indicator before using the indicator; and in the program to determine the length of the K-line data used to calculate the indicator; so as not to calculate an invalid value if the length is insufficient, and use an invalid value will cause a program error.
Below we use a chart interface to display the calculated indicator on the chart and compare it to the real-time chart of the exchange (OKCoin is selected on the real-time chart):
var ChartCfg = {
tooltip: {xDateFormat: '%Y-%m-%d %H:%M:%S, %A'},
    chart: { zoomType:'x',panning:true },//图表类型
    title: { text: "K-macd"}, //标题
    rangeSelector: {
            buttons:  [{type: 'hour',count: 1, text: '1h'}, {type: 'hour',count: 3, text: '3h'}, {type: 'hour', count: 8, text: '8h'}, {type: 'all',text: 'All'}],
            selected: 0,
            inputEnabled: false
        },
    subtitle: {text: "测试macd"},//副标题
    xAxis:{type: 'datetime'},
    yAxis: [{
            title: {text: 'K线'},//标题
            style: {color: '#4572A7'},//样式
            opposite: false  //生成右边Y轴
        },
       {
            title:{text: "macd"},
            opposite: true  //生成右边Y轴  ceshi
       }
    ],
    series: [//系列
        {type:'candlestick',yAxis:0,name:'K',id:'KLine',data:[]},
        {name:"DIF",type:'spline',yAxis:1,data:[]},
        {name:"DEA",type:'spline',yAxis:1,data:[]},
        {name:"MACD量柱",type:'spline',yAxis:1,data:[]},
        ]
};
function main(){
    var records = null;
    var macd = null;
    var perRecords = _C(exchange.GetRecords);
    var perRecordTime = perRecords[perRecords.length - 1].Time;
    var chart_obj = Chart(ChartCfg); // 初始化图表
    chart_obj.reset();
    while(true){
        records = _C(exchange.GetRecords);  // 获取K线数据 ,默认为策略界面设置的K线周期, _C 是一个容错的内置函数。
        if(!records && records.length < 26 ){
            continue;
        }
        macd = TA.MACD(records, 12, 26, 9);   // 不加参数的话,使用的是默认参数  12, 26, 9
        if(records[records.length - 1].Time !== perRecordTime){                                    // _C 详见 https://www.fmz.com/bbs-topic/320  问题7。
            //先更新,再添加K线
            chart_obj.add(0, [records[records.length - 2].Time, records[records.length - 2].Open, records[records.length - 2].High, records[records.length - 2].Low, records[records.length - 2].Close], -1);   // 跟新刚完成的bar。
            chart_obj.add(0, [records[records.length - 1].Time, records[records.length - 1].Open, records[records.length - 1].High, records[records.length - 1].Low, records[records.length - 1].Close]);       // 添加新出现的bar
            //先更新,添加指标线
            chart_obj.add(1, [records[records.length - 2].Time, macd[0][records.length - 2]], -1);   // 更新
            chart_obj.add(1, [records[records.length - 1].Time, macd[0][records.length - 1]]);

            chart_obj.add(2, [records[records.length - 2].Time, macd[1][records.length - 2]], -1);   // 更新
            chart_obj.add(2, [records[records.length - 1].Time, macd[1][records.length - 1]]);

            chart_obj.add(3, [records[records.length - 2].Time, macd[2][records.length - 2]], -1);   // 更新
            chart_obj.add(3, [records[records.length - 1].Time, macd[2][records.length - 1]]);

            perRecordTime = records[records.length - 1].Time;
        }else{
            //只更新当前的bar 和 线
            chart_obj.add(0, [records[records.length - 1].Time, records[records.length - 1].Open, records[records.length - 1].High, records[records.length - 1].Low, records[records.length - 1].Close], -1);
            chart_obj.add(1, [records[records.length - 1].Time, macd[0][records.length - 1]], -1);   // 更新
            chart_obj.add(2, [records[records.length - 1].Time, macd[1][records.length - 1]], -1);   // 更新
            chart_obj.add(3, [records[records.length - 1].Time, macd[2][records.length - 1]], -1);   // 更新
        }
        chart_obj.update(ChartCfg);
        Sleep(1000);
    }
}
The K-line cycle parameter on the robot interface is set to 1 minute, so a slightly smaller cycle is selected because it takes a while to run to see the effect.
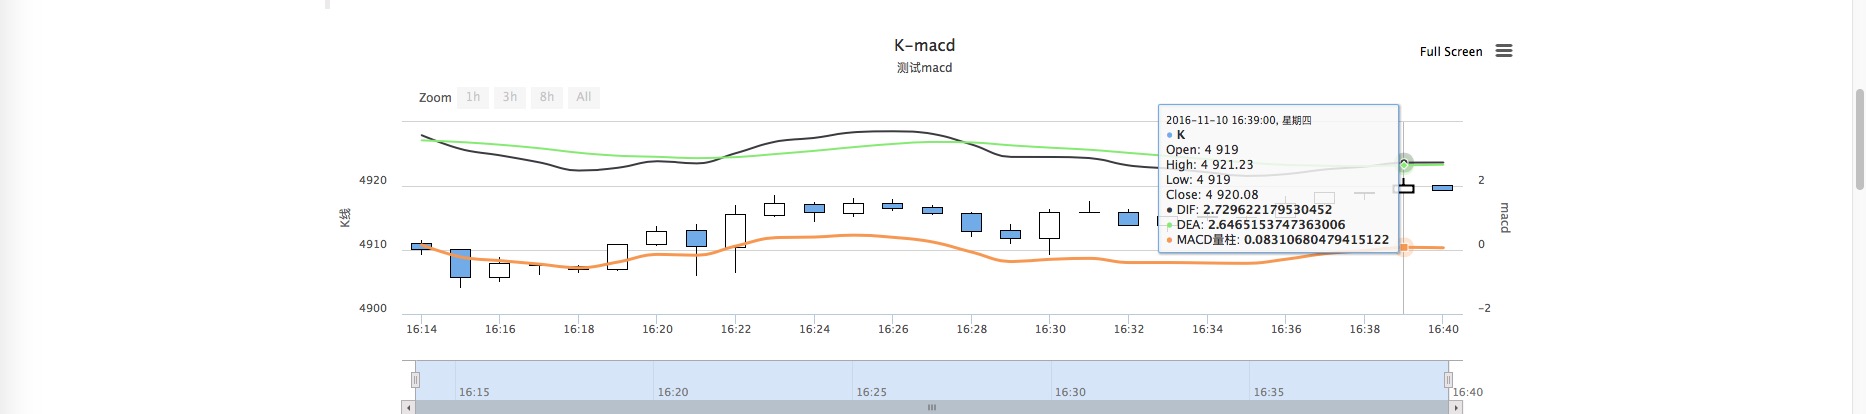
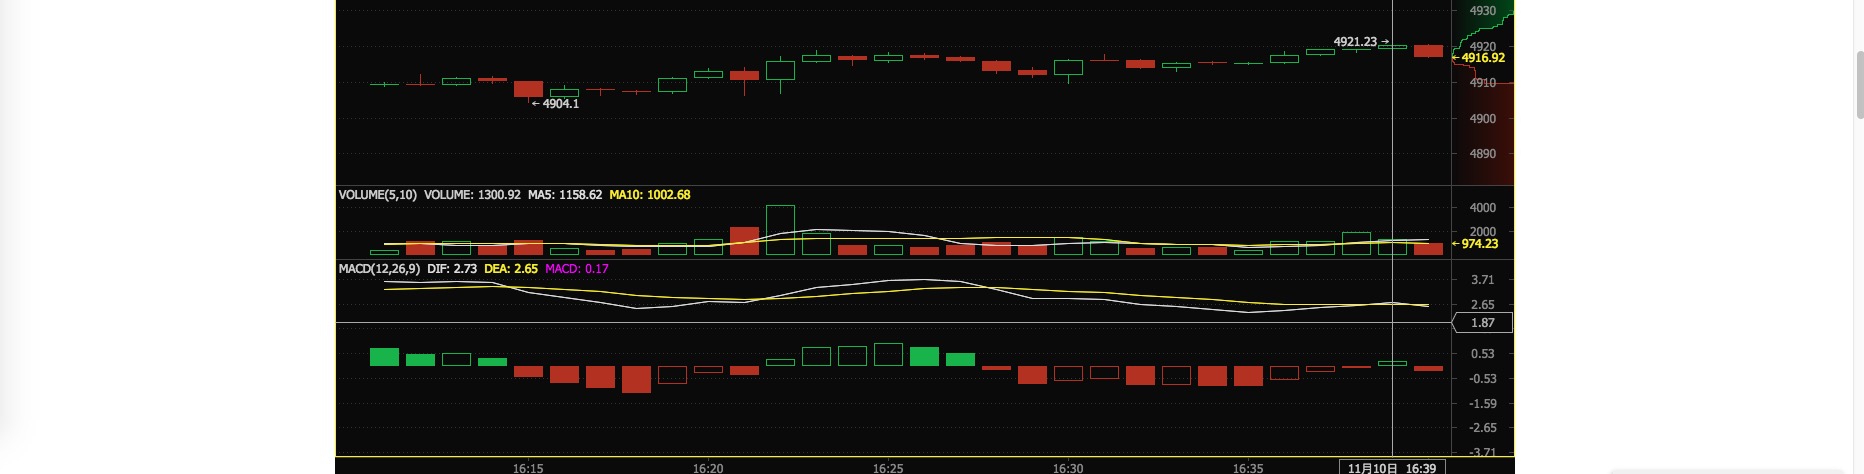
As seen from the graph The inventor quantified The robot ran The calculated DIF is about 2.729 and the DEA is about 2.646 The MACD volume column is about 0.0831 The actual OKCoin exchange chart shows a DIF of 2.73, a DEA of 2.65, and a MACD of 0.17 As you can see, the difference between the first two DIFs, DEAs, OKCoin is very small, OKCoin is four-fifths, MACD is twice as bad, because OKCoin is calculated like this: (DIF - DEA) * 2, usually DIF - DEA = 2.729 - 2.646 = 0.083, if multiplied by 2 again, 0.166 is approximately equal to 0.17.
Other indicators are used in a similar manner.
-
talib - http://ta-lib.org/
In addition to the indicators commonly used in TA, there are many other indicators in the talib library. For example, let's try using the indicator talib.STOCHRSI, and look at the API documentation description:
STOCHRSI	Stochastic Relative Strength Index
STOCHRSI(Records[Close],Time Period = 14,Fast-K Period = 5,Fast-D Period = 3,Fast-D MA = 0) = [Array(outFastK),Array(outFastD)]
As you can see, the parameter setting is talib.STOCHRSI ((records, 14, 14, 3, 3); basically still top MACD-like code, with some changes, run and see.
var ChartCfg = {
tooltip: {xDateFormat: '%Y-%m-%d %H:%M:%S, %A'},
    chart: { zoomType:'x',panning:true },//图表类型
    title: { text: "stochrsi"}, //标题
    rangeSelector: {
            buttons:  [{type: 'hour',count: 1, text: '1h'}, {type: 'hour',count: 3, text: '3h'}, {type: 'hour', count: 8, text: '8h'}, {type: 'all',text: 'All'}],
            selected: 0,
            inputEnabled: false
        },
    subtitle: {text: "测试stochrsi"},//副标题
    xAxis:{type: 'datetime'},
    yAxis: [{
            title: {text: 'K线'},//标题
            style: {color: '#4572A7'},//样式
            opposite: false  //生成右边Y轴
        },
       {
            title:{text: "K-D"},
            opposite: true  //生成右边Y轴  ceshi
       }
    ],
    series: [//系列
        {type:'candlestick',yAxis:0,name:'K',id:'KLine',data:[]},
        {name:"K",type:'line',yAxis:1,data:[]},
        {name:"D",type:'line',yAxis:1,data:[]},
        ]
};
function main(){
    var records = null;
    //var macd = null;
    var stochrsi = null;
    var perRecords = _C(exchange.GetRecords);
    var perRecordTime = perRecords[perRecords.length - 1].Time;
    var chart_obj = Chart(ChartCfg); // 初始化图表
    chart_obj.reset();
    while(true){
        records = _C(exchange.GetRecords);  // 获取K线数据 ,默认为策略界面设置的K线周期, _C 是一个容错的内置函数。
        if(!records && records.length < 26 ){
            continue;
        }
        //macd = TA.MACD(records, 12, 26, 9);   // 不加参数的话,使用的是默认参数  12, 26, 9
        stochrsi = talib.STOCHRSI(records, 14, 5, 3, 0);
        if(records[records.length - 1].Time !== perRecordTime){                                    // _C 详见 https://www.fmz.com/bbs-topic/320  问题7。
            //添加K线
            chart_obj.add(0, [records[records.length - 2].Time, records[records.length - 2].Open, records[records.length - 2].High, records[records.length - 2].Low, records[records.length - 2].Close], -1);   // 跟新刚完成的bar。
            chart_obj.add(0, [records[records.length - 1].Time, records[records.length - 1].Open, records[records.length - 1].High, records[records.length - 1].Low, records[records.length - 1].Close]);       // 添加新出现的bar
            //添加指标线
            chart_obj.add(1, [records[records.length - 2].Time, stochrsi[0][records.length - 2]], -1);   // 更新
            chart_obj.add(1, [records[records.length - 1].Time, stochrsi[0][records.length - 1]]);

            chart_obj.add(2, [records[records.length - 2].Time, stochrsi[1][records.length - 2]], -1);   // 更新
            chart_obj.add(2, [records[records.length - 1].Time, stochrsi[1][records.length - 1]]);

            perRecordTime = records[records.length - 1].Time;
        }else{
            //只更新当前的bar 和 线
            chart_obj.add(0, [records[records.length - 1].Time, records[records.length - 1].Open, records[records.length - 1].High, records[records.length - 1].Low, records[records.length - 1].Close], -1);
            chart_obj.add(1, [records[records.length - 1].Time, stochrsi[0][records.length - 1]], -1);   // 更新
            chart_obj.add(2, [records[records.length - 1].Time, stochrsi[1][records.length - 1]], -1);   // 更新
        }
        chart_obj.update(ChartCfg);
        LogStatus("倒数第一组数据:", stochrsi[0][stochrsi[0].length - 1], stochrsi[1][stochrsi[1].length - 1], "    倒数第二组数据:", stochrsi[0][stochrsi[0].length - 2], stochrsi[1][stochrsi[1].length - 2]);
        Sleep(1000);
    }
}
I didn't show a screenshot, but there is a difference between the official figures and OKCoin, and BOSS says that the implementation algorithm of the talib library may be different from OKCoin.Understanding the STOCHRSI indicatorI'm writing this without optimization, it's very inefficient, it runs very slowly, so let's learn.
- Bitcoin High Frequency Strategy Ideas to be recommended
- The three secrets of keeping a quantized model alive
- High-frequency trading strategies based on machine learning
- 2.9 Debugging in the run of the strategy robot (JS - the usefulness of the eval function)
- In fact, past prices don't really affect the future.
- What does "co-integration" mean in statistical terms?
- 3.4 Complement the strategic framework to get the robots up and running!
- 3.3 The general architecture of the strategic process, a strategic framework
- 3.1 Template:Repeatable code _ Directory of digital currency spot transactions
- 2.6 Goods
- 2.5 Interface showing API policy interaction
- 2.4 Get order information, cancel orders, and get all unfinished orders
- 2.3 List of market prices
- 2.2 Lower price lists
- 2.1 Use the API to access account information, market data, K-line data, and market depth
- Other functions
- 1.3.4 Robots and strategies
- 1.3.3 The exchange
- 1.3.2 Getting to Know the Trustee
- 1.3.1 Overview and architecture of the main interface
hokshelatoYou say that the last K-line needs to be updated and added first, because the last K-line is always changing, and the first K-line is only fixed when a new K-line is generated. I don't understand, the K-line data obtained by `GetRecords (() ` is not definite? `records (length -1) ` represent the K-line data under the current time stamp, directly drawn into the graph, waiting for the new K-line data with the time stamp, then added to the last element of the graph, right?
shandianliyuIs there a more detailed description of TA.ATR ((records, 14) that I can't find in the BotVS API documentation, videos, or even in the full user manual. When I call TA.ATR ((records, 14) ((parameter is 30 minutes k line), it returns an array of 177 in length. What is the meaning of this array?
FangBeiPython version This is a list of all the different ways Dn-filebox.qbox.me/b5d2b0ecc1e196a6bfc68eb45cd818c50d279915.png is credited in the database.
FangBeiPython version def main (: while true: records = _C ((exchange.GetRecords); # Retrieves K-line data, assuming by default that the policy interface sets the K-line cycle, _C is an error-free built-in function. macd = TA.MACD ((records); # If no parameters are added, the default parameters are 12, 26, 9 Log (("macd[0]", macd[0]); # DIF Log (("macd[1]", macd[1]); # DEA Log (("macd[2]", macd[2]); # MACD Log (("macd[0] length", len ((macd[0])); # DIF length Log (("macd[1] length", len ((macd[1])); # DEA length Log (("macd[2] length", len ((macd[2])); #MACD length Log (("records Length:", len ((records)); # shows the length of records. Sleep ((1000 * 60 * 5);
The Little DreamThe timestamp of the K-line Bar is the start time of this Bar, not real time, and the start time of the Bar does not change.
hokshelatoHey, the mistake I understood before was in the timeline of the K line. After debugging, I found out that the mechanism of BotVS is like this, for example, the K line you mentioned: If I want to get the K-line data for March 1st, calling GetRecords (D1) will return a lot of records, but they all have the same timestamp, which is `2018-03-01 00:00:00`. That is, even if I called GetRecords on March 1st at 10 o'clock, the K-line timestamp I got was still 2018-03-01 **00**:00:00. So the last one you said would be uncertain until there was a new timestamp, 2018-03-**02** 00:00:00, so the time of the day on March 1st is uncertain. My previous misunderstanding was that I thought that the time I returned after calling at 1:00, 2:00, and 3:00 on March 1 was different, i.e. 2018-03-01 **01**:00:00, 2018-03-01 **02**:00:00, 2018-03-01 **03**:00:00.
The Little DreamGetRecords (()) obtained K-line data. Except for the first decimal, the rest is determined ((because the cycle has been completed), the first decimal is uncertain because the cycle has not ended, Close is always changing. For example, the daily K-line, the current daily K-line column, when today is not over, no one knows what the price will end up being today. Closing.
The Little DreamIt's not polite.
shandianliyuI understand, thank you very much!
The Little DreamYes, corresponding to the first K-line bar.
shandianliyuOkay, thank you very much for your answer. Lastly, confirm that var a = TA.ATR ((records, 14), a[a.length-1] is the ATR of the most recent k-line data, right?
The Little DreamYes Specifically, the amount of return is based on the exchange and cannot be specified. So the exchange generally provides limited data.
shandianliyuThis I understand, TA.ATR))) is essentially a mathematical operation on the incoming records. I didn't make it clear before, but I wanted to ask if the length of the return is determined by the exchange when using the function exchange.GetRecords))) to get the k-string data.
The Little DreamThis indicator function returns how much data is corresponding to the K-line data, which is records, the length of the records array you entered, and the length of the computed length.
shandianliyuI'm sorry, I'm still not quite clear, I mean, if you call this function, is the length of the data returned given by the exchange? I found that calling this function at different times, even if the parameters are the same, the length of the data returned may be different.
The Little DreamAnd the length of the line is determined by the length of the line K.
shandianliyuThank you for your answer, that's clear, but I would also like to ask, what determines the length of this 117?
The Little DreamFor example, the incoming records are the K-line of the day, and the ATR is an array, the first element of which is the ATR indicator of the day (the date of the last K-line of the day).
The Little DreamI'm going to get a chestnut. If now the K-line data is only 10 Bar, and I ask for MA ((15) i.e. 15 cyclic averages, then it is definitely not possible to find out, because only 10 cycles, it is not possible to calculate the average of 15 cycles.
FangBeiAlso, I did a real-time tick retest, and no data was returned.
FangBeiWhy is it that the data above does not meet the cyclical requirements?
The Little DreamThis is a good example, but in practical use, the latest indicator data is at the end of the array, which is the element with index −1. The front does not meet the cycle requirement. The following are some useful data, such as: This is a list of all the different ways Dn-filebox.qbox.me/b7837ea30e5d8396ffa91c48204f2fbc9a7f4504.png is credited in the database.