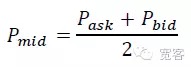
High-frequency trading strategies based on machine learning
Author: The Little Dream, Created: 2016-11-16 16:52:38, Updated: 2016-11-16 16:55:18High-frequency trading strategies based on machine learning
-
The first is the theory.
The trading mechanisms of the securities market can be divided into two types: bid-driven and order-driven markets, the former relying on market makers to provide liquidity, the latter providing liquidity through quotes, and the latter trading through bid-offer and offer-offer bidding by investors. The Chinese securities market is an order-driven market, including the stock market and the futures market.
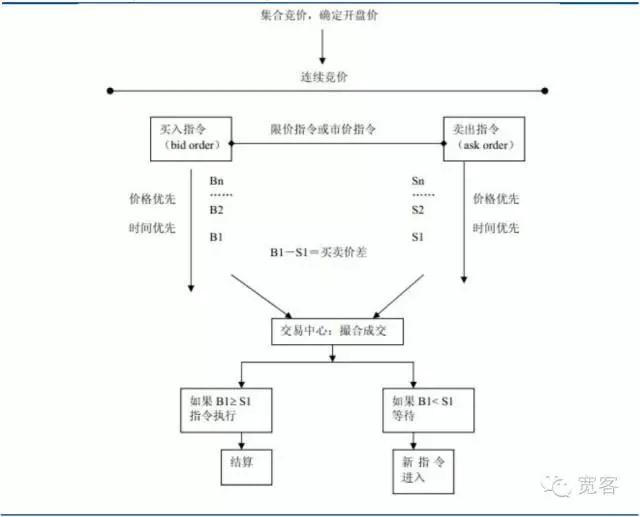 Figure 1 Orders driving market maps
-
(a) The price of the order book
The study of the order book belongs to the category of market microstructure studies, the theory of market microstructure uses price theory and vendor theory in microeconomics as the source of its ideas, and in the analysis of its core issues, the process and causes of the formation of prices, general equilibrium, local equilibrium, marginal gains, marginal costs, market continuity, inventory theory, game theory, information economics, etc.
From the progress of the research abroad, the field of market microstructure is represented by O
Hara, where most theories are based on market-driven markets (i.e. bid-driven markets), such as inventory models and information models, etc. In the last year, order-driven markets have gradually taken over the top of the actual trading market, but there has been relatively little research specifically on order-driven markets. Both the domestic securities market and the futures market are order-driven markets. The following is a screenshot of the Level_1 market order book of the stock index futures contract IF1312. There is not much information directly obtained from above, the basic information includes a buy price, a sell price, a buy quantity and a sell quantity. In some academic papers abroad, there is also an information book corresponding to the order book, including the most detailed order collection data, including the amount of orders placed, the price paid, the type of orders, etc.
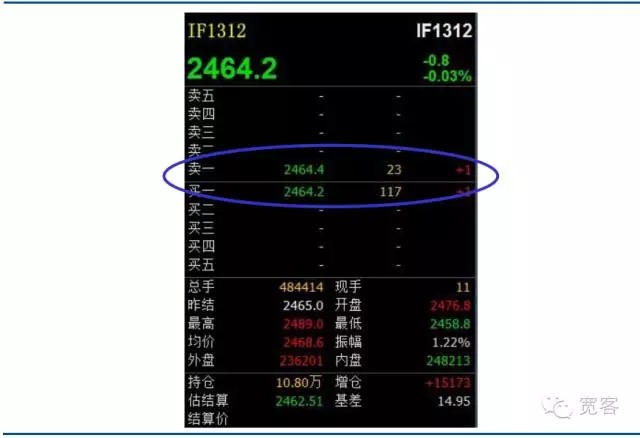 Figure 2 Equity index futures main contracts Level-1 order book
 -
(ii) Progress in research on high-frequency trading in the order book
There are two main approaches to dynamic modeling of the order book, the classical metric economics method and the machine learning method. The metric economics method is a classic mainstream research method, such as the MRR decomposition of the study price difference analysis, the Huang and Stoll decomposition, the ACD model of the order duration, and the logistic model of the study price prediction.
Academic research in the field of machine learning is also very active in finance, for example, the 2012 study Forecasting trends of high_frequency KOSPI200 index data using learning classifiers is a common research idea that uses common indicators of technical analysis (MA, EMA, RSI, etc.) to introduce classification methods of machine learning to make market predictions. However, this practice is not enough to mine order book dynamic information, that is, there is relatively little research on using order book dynamic information to make high leverage transactions both at home and abroad, which is an area worth exploring in depth.
-
-
Application of machine learning in high-frequency order book transactions
-
(a) The architecture of the system
The following diagram is a system architecture of a typical machine learning trading strategy, including order book data, feature discovery, model building and validation, and several major modules of trading opportunities. It is noteworthy that the trading process is triggered by market events, the arrival of the tick market being one of them.
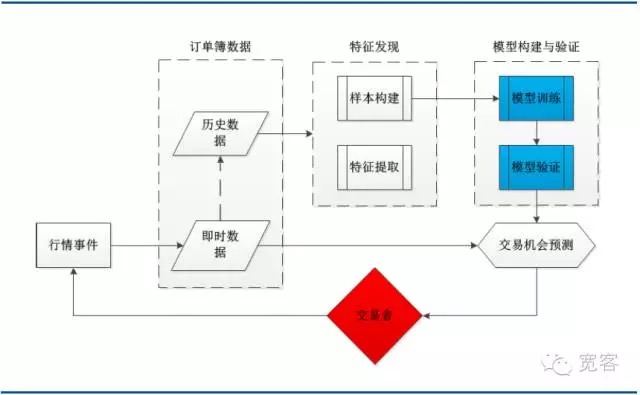 Figure 3 System architecture of order book modeling based on machine learning
 -
(b) Support for vector machine
In the 1970s, Vapnik et al. began to develop a more complete set of theoretical systems for statistical learning theory (SLT), which is used to study statistical laws and the nature of learning methods in finite sample situations, to establish a good theoretical framework for finite sample machine learning problems, and to better solve practical problems such as small samples, nonlinearity, high-dimensional numbers and local extremes. In 1995, Vapnik et al. clearly proposed a new general learning method that supports vector quantity vectoring (SVM, Support Vector Machine).
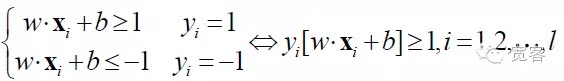
SVM evolved from the optimal classification superplanes in linear differentiable cases. For two types of classification problems, the training sample set is set to ((xi,yi), i=1,2...l, l is the number of individuals in the training sample, xi is the training sample, yi belongs to {-1+,1} is the class marker of the input sample xi ((expected output)).
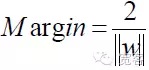
The optimal classification hyperplane not only separates all samples correctly (the training error rate is 0), but also maximizes the margin between the two classes, defined as the sum of the minimum distance between the training data set and the classification hyperplane.
If there is a hyperplane in d-dimensional vector space:
F(x)=w*x+b=0
The two types of data can be separated, and the superplane is called a partition interface; where w*x is the interior of two vectors w and x in d-dimensional vector space.
If the interface is split:
w*x+b=0
The interface is called the optimal interface if the distance between the two nearest samples of the interface is maximized.
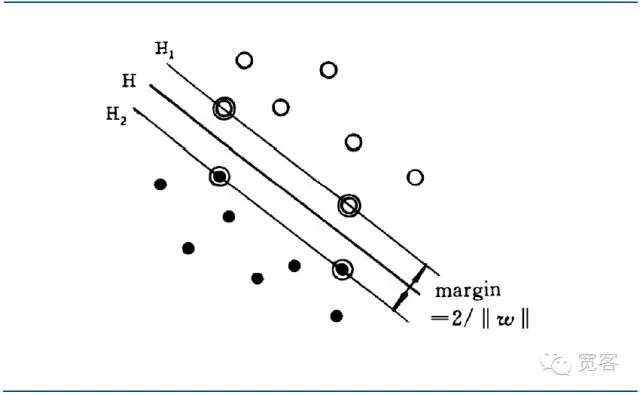 Figure 4 SVM binary most preferred interface diagram
Unification of the optimal differential interface equation to make the distance between the two sample types
So for any given sample, there's
In order to get the optimal interface, in addition to satisfying the above formula, it is necessary to minimize it.
The mathematical model of the SVM problem is:
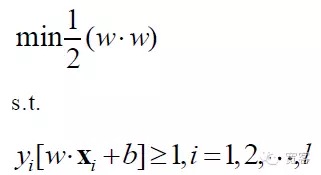
SVM eventually became one of the most optimized planning problems, with academic research focusing on rapid solutions, multiclass popularization, and practical problem applications.
SVM was originally proposed for binary classification problems, and has been extended to multiclass problems based on current practical application requirements. Existing multiclass algorithms include one-to-many, one-to-one, error correcting, DAG-SVM, and Multi i-class SVM classifiers.
-
(iii) Extraction of order book indicators
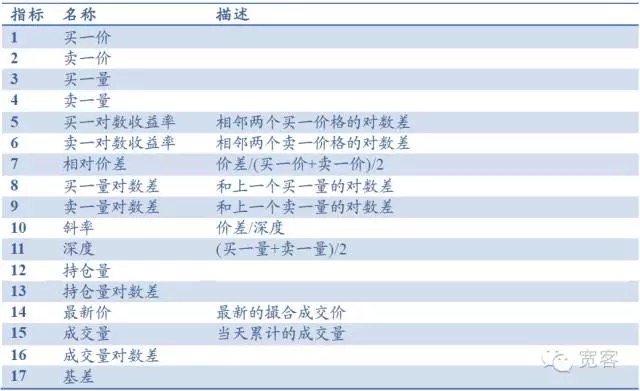
For example, in the Level-1 stock index futures market, the order book mainly consists of basic indicators such as buy, sell, buy, sell, and can be derived from indicators such as depth, slope, relative spread, and other indicators such as holding volume, volume, margin, etc. There are 17 indicators in total, as shown in the table below.
Table 1 Index database based on the Level market order book
-
(iv) Dynamic characteristics of the order book and trading opportunities
From a market microscopic perspective, there are two methods of measuring price movements in the short term, one is the median price movement and the other is the price differential crossover.
According to the order book, the magnitude of the change in the middle price ΔP in Δt is divided into three categories.
The chart below shows the distribution of the median price movement of the main contract IF1311 on October 29, with 32400 tick market data per day.
In the case of Δt = 1 tick, the absolute value of the change in the middle price of 0.2 is about 6000 times, the absolute value of 0.4 is about 1500 times, the absolute value of 0.6 is about 150 times, the absolute value of 0.8 is about 50 times, and the absolute value of the change is about 10 times greater than or equal to 1.
In the case of Δt=2 tick, the absolute value of the change in the middle price of 0.2 is about 7000 times, the absolute value of 0.4 is about 3000 times, the absolute value of 0.6 is about 550 times, the absolute value of 0.8 is about 205 times, and the absolute value of change is about 10 times greater than or equal to 1.
We assume that the absolute value of the change is greater than or equal to 0.4, which is a potential trade opportunity. There are about 1700 opportunities per day for Δt = 1 tick; there are about 4000 opportunities per day for Δt = 2 tick.
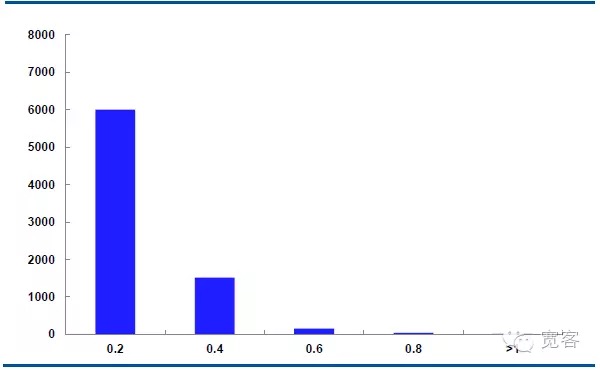
Figure 5 IF1311 distribution of changes in the mid-price on October 29 ((Δt=1 tick)
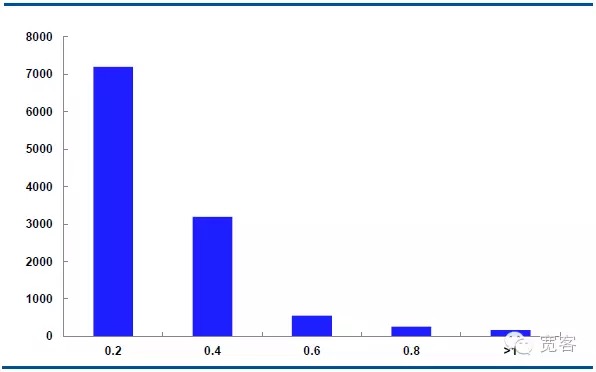
Figure 6 IF1311 distribution of changes in the mid-price on October 29 ((Δt=2 tick)
-
-
Third, strategic evidence
Because the SVM model has a relatively high training complexity and a long training time in large sample situations, we selected a relatively short span of historical market data to validate the model's effectiveness, using the Level_1 market data from the IF1311 contract in October.
-
(a) Model effect testing
Data cycle: Market data for the IF1311 contracts in October;
Δt take: The smaller the Δt, the higher the demand for transaction details, and when Δt = 1 tick, it is difficult to get a return in the actual transaction.
The indicators for evaluating the model are: sample accuracy, test accuracy, prediction time.
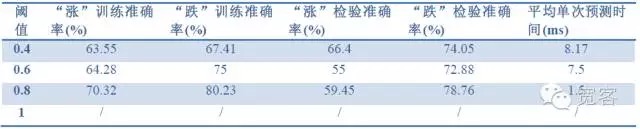 Table 2 predicts the effect of 1 tick on 1 tick data
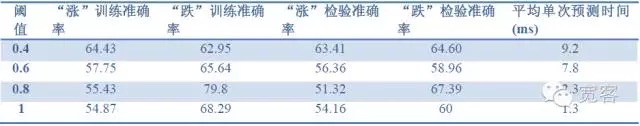 Table 3 predicts the effect of tick 2 with 1 tick data
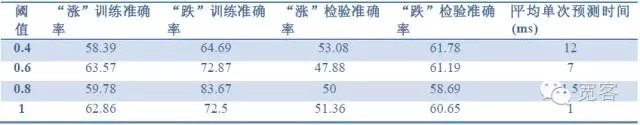 Table 4 predicts the effect of 2 ticks on 2 tick data
From the data of the above three tables, we can draw some conclusions: The maximum accuracy is about 70%, and the accuracy of 60% can be translated into a trading strategy.
-
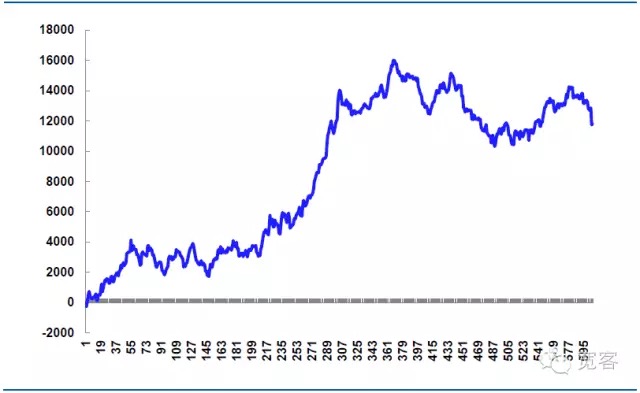
(ii) Strategic simulation of gains
For example, on 31 October, we conducted a simulated trade, where the institution's stock futures trading fee is generally 0.26/10000, and we assume that the number of trades is not capped, assuming that the one-sided price slippage is 0.2 points per trade, and the number of single hands is 1 hand per trade.
Table 5 Simulated trading strategy as of 31 October

The total number of transactions throughout the day was 605 times, including procedures, and the number of profits was 339 times, with a winning rate of 56%, and a net profit of 11814.99 yuan.
Theoretically, the slippage price is 14,520 yuan, which is the key to strategic real-world warfare. If the details of the order are controlled more precisely, the slippage price can be reduced and the net profit increased. If the details of the order are not controlled properly, or the market fluctuates abnormally, the slippage price will be larger, and the net profit will be reduced, so the success of high-frequency trading often depends on the execution of details.
Figure 7 The earnings of the simulation strategy on October 31
-
Original statement: This article was originally published on the official website of the People's Republic of China.
- Is there a bot error code query?
- Interesting investment math!
- Math and gambling (1)
- Inventor quantification Commodity futures cooperative process of opening
- Futures and options
- Rethinking the Uniform System
- The Kelly formula for positioning control of the lever
- The trend trading of an old bird, the idea of a quantitative trading system
- Bitcoin High Frequency Strategy Ideas to be recommended
- The three secrets of keeping a quantized model alive
- 2.9 Debugging in the run of the strategy robot (JS - the usefulness of the eval function)
- In fact, past prices don't really affect the future.
- What does "co-integration" mean in statistical terms?
- 3.4 Complement the strategic framework to get the robots up and running!
- 3.3 The general architecture of the strategic process, a strategic framework
- 3.1 Template:Repeatable code _ Directory of digital currency spot transactions
- 2.6 Goods
- 2.7 Use of indicators
- 2.5 Interface showing API policy interaction
- 2.4 Get order information, cancel orders, and get all unfinished orders
evan1987Goodwin is learning how to study ordering thin