Rethinking the Uniform System
Author: The Little Dream, Created: 2016-11-30 11:51:51, Updated: 2016-11-30 11:56:27Rethinking the Uniform System
-
1. Reviewing the equatorial system
For investors new to technical analysis, the mean line system is a very intuitive and effective indicator. This intuitive behavior means that when the closing price breaks through or falls through the mean line, that is, P > ` P or P < ` P, the trend is likely to reverse and sends a warning signal. When the closing price breaks through or falls through the mean line in succession, forming an effective breakout or fall against the mean line, and the mean line also slowly turns from its original upward or downward movement in the stock price to form support or pressure on the price, the original trend is reversed and a new trend is created.
However, the equilateral triangle theory also has certain flaws, which are manifested as lagging, fracturing, and fracturing.
This is a natural phenomenon, because it's a natural phenomenon, because it's a natural phenomenon.P = (P1+P2+P3+…+Pn)/n,而当Pn >P or Pn< ` P, and the price of the stock is to form an effective break or fall of the average line, new trends have been generated, often have missed the lows or highs, for investors who prefer short lines will passively raise certain costs.
Secondly, the traditional equatorial theory is generally used more at the sunline level, and the study of small-scale equatorial lines below the sunline level is less common, and the small-scale equatorial line setup also lacks a certain basis, leading to large-scale equatorial lines being split, viewed independently, without being organically combined, which is not in line with the development trend of contemporary technical analysis. The trend of contemporary technical analysis is to explore the linkage of large-scale and small-scale, the development of processes is like planting the next seed in the soil, slowing down, sprouting, finally flowering, the formation of large-scale processes, is the beginning of small-scale evolution.
Therefore, this article combines the definition of trends in the field of technical analysis and the development of contemporary technical analysis, to rethink the system of linear equations, trying to overcome the backwardness of linear systems, to make the linear system more like a complete system.
-
2 What is the trend?
First of all, the K line is simplified, the closing price and opening price of the K line are not taken into account, only the highest and lowest prices of the K line are shown, and it is assumed that there is no contained relationship between the two K lines. In this case, either on the 5-minute K line chart or on the circular chart, the simplest and most complete, clear market segment requires at least 5 K lines to describe, as shown in the figure:
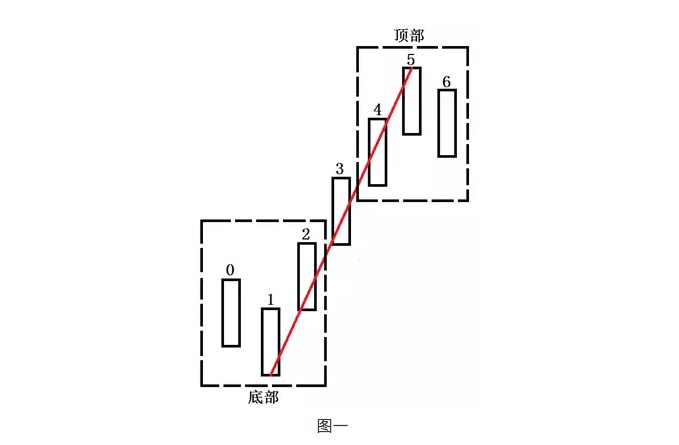
In Figure 1, the three K-lines 0, 1 and 2 form the bottom, the bottom characterized by the lowest and highest points of the middle K-line being lower than the two adjacent K-lines; the analogy 4, 5 and 6 K-lines form the top, the top characterized by the lowest and highest points of the middle K-line being higher than the two adjacent K-lines. At the same time, there is at least one K-line that is not shared between the bottom and top, i.e. the 3 K-line of the figure, separating the bottom and top sections, thus clearing the line between the bottom and the top.
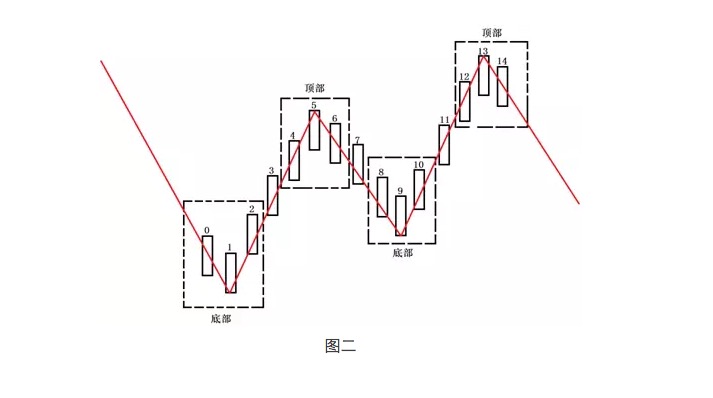
With the above as a basis, it is necessary to know that the formation of the trend requires at least 13 K lines to be confirmed, as shown in Figure 2: Assuming that the trend before the K line 1 is a significant one-sided downtrend, the K line 1 to 5 is the first segment of the uptrend, the K line 5 to 9 is the first retracement, and this retracement cannot create a new low of the K line 1, while the K line 9 to 13 is the second segment of the uptrend, and the high of the 13 K line is only higher than the high of the 5 K line, and to effectively break through the high of the 5 K line, in order to technically constitute the old trend, at least a complete, new transition. Assuming that the K line 5 to 13 is the first segment of the uptrend, due to the dramatic change in the fundamentals, the new trend has just been formed, but the technical transition has just occurred, but the complete trend of the K line 1KKKKKKKKKKKKKKKKKKKKKKKKK
-
3, reset the equator
With the content of the previous section as a basis, a 60-point example is used to deduce the reset of the equator.
一段周线行情
= 至少有5根周K线构成
= 至少有25根日K线构成(一周5个交易日)
= 至少有100根60分钟K线构成(一天4个小时)

一段周线行情
= 日线一定形成新的趋势
= 至少有13根日K线构成
= 至少有52根60分钟K线构成

一段日线行情
= 至少有5根日K线构成
= 至少有20根60分钟K线构成

一段日线行情
= 60分钟一定形成新的趋势
= 至少有13根60分钟K线构成

一段60分钟行情
=至少有5根60分钟K线构成

因此,60分钟的均线设置如下:
MA1 = 5; MA2 = 13; MA3 = 20; MA4 = 52;MA5 = 100;

同理,不同的级别图上,均线都可以参照上述内容来进行设置,此处省略推导过程,需要特别说明的是两个级别组合:

组合1:周线-日线-30分钟-5分钟;组合2:周线-日线-60分钟-15分钟

在周线图上,均线设置如下:
MA1 = 5;MA2 = 13;MA3 = 20;MA4 = 52;MA5 = 60;

在日线图上,均线设置如下:
MA1 = 5;MA2 = 13;MA3 = 25;MA4 = 65;MA5 = 100;

在15分钟图上,均线设置如下:
M1 = 5;MA2 = 13;MA3 = 20;MA4 = 52;MA5 = 80;

在30分钟图上,均线设置如下:
MA1 = 5;MA2 = 13;MA3 = 40;MA4 = 104;MA5 = 200;

在5分钟图上,均线设置如下:
MA1 = 5;MA2 = 13;MA3 = 30;MA4 = 78;MA5 = 240;
-
4 Conclusions
MA1 describes a segment at this level, MA2 describes a trend at this level, MA3 describes a segment at a higher level, MA4 describes a trend at a higher level, MA5 describes a segment at two higher levels, so that on different levels of the graph, the more advanced level of the equation can be plotted on a smaller level of the graph, so that the large and small level of the equation can be viewed as a whole, and the efficiency of the equation system will also be improved.
Firstly, the reaction of large-scale movements on small-scale graphs can overcome the lag of the averages to a certain extent, for example, the 5-day averages, need to wait until the fifth day closing price to calculate the 5-day averages, while on 60-minute graphs, the disk can react in time, that is, the speed of the MA3 is faster than the MA1 on the daily chart, the results of both calculations are not the same, but very close, and obviously, the smaller the level, the more accurate.
Secondly, when the closing price of several consecutive K-lines breaks or falls below the 5-cycle averages, forming an effective break or fall, it means that this level is likely to open a bullish or bearish market, and sends a warning signal; when the 5-cycle averages and the 13-cycle averages form multiple heads or blank heads, it means that the signal is established.
When the 5-period equinox and the 13-period equinox form a polygonal or hollow line, it means that the trend at this level is likely to reverse, and when the 5-period equinox, 13-period equinox and the MA3 triple equinox form a polygonal or hollow line, it means that the beginning of a period of higher level, the trend reversal at this level is confirmed.
Similarly, when the 5-period equinoxes, 13-period equinoxes, MA3 and MA4 are polygonal or spacetime, a high-level trend reversal is likely, while when the five-period equinoxes MA1, MA2, MA3, MA4, MA5 are simultaneously polygonal or spacetime, a high-level trend reversal is confirmed.
Levels can be expanded indefinitely, but it makes no sense to level them too much, because the larger the level, the stronger the lag.
In addition, there are also some advanced techniques for using the equatorial system, such as at high levels, MA1 and MA2 are wrapped several times, the area of the packaging is smaller and smaller, a reversal signal that the trend at this level is about to see a peak, and at low levels, a reversal signal that the trend at this level is about to see a bottom; on the equatorial system of transactions, it is also possible to refer to the equatorial setting of this article, which presents a new type of quantity-price cooperation, which will also be the direction of my subsequent research.
Translated from QuantPlus
- 20 Tips for Developing a Creative Mind
- Machine learning compares the 8 major algorithms
- Investing in winners: the secret to counter-intuitive thinking
- The basic requirements of a trading system
- The true amplitude of the ATR indicator used
- Is there a bot error code query?
- Interesting investment math!
- Math and gambling (1)
- Inventor quantification Commodity futures cooperative process of opening
- Futures and options
- The Kelly formula for positioning control of the lever
- The trend trading of an old bird, the idea of a quantitative trading system
- Bitcoin High Frequency Strategy Ideas to be recommended
- The three secrets of keeping a quantized model alive
- High-frequency trading strategies based on machine learning
- 2.9 Debugging in the run of the strategy robot (JS - the usefulness of the eval function)
- In fact, past prices don't really affect the future.
- What does "co-integration" mean in statistical terms?
- 3.4 Complement the strategic framework to get the robots up and running!
- 3.3 The general architecture of the strategic process, a strategic framework