How to use a template for drawing two Y-axes
Author: The Little Dream, Created: 2017-04-07 14:14:29, Updated: 2017-10-11 10:26:42How to use a template to draw two Y-axes
-
Can be copied first
画线类库This template is now available in its own control center.
画线类库
简化了策略图表画线的逻辑, 可以直接调用封装好的函数

支持画多条线
支持K线图
支持flag小图标
你也可以添加更多图形的支持
function main() {
    var isFirst = true
    while (true) {
        var records = exchange.GetRecords();
        if (records && records.length > 0) {
            $.PlotRecords(records, 'BTC')
            if (isFirst) {
                $.PlotFlag(records[records.length-1].Time, 'Start', 'S')
                isFirst = false
            }
        }
        var ticker = exchange.GetTicker()
        if (ticker) {
            $.PlotLine('Last', ticker.Last)
            $.PlotTitle('Last ' + ticker.Last)
        }

        Sleep(60000)
    }
}
The following problems may occur when using this template:
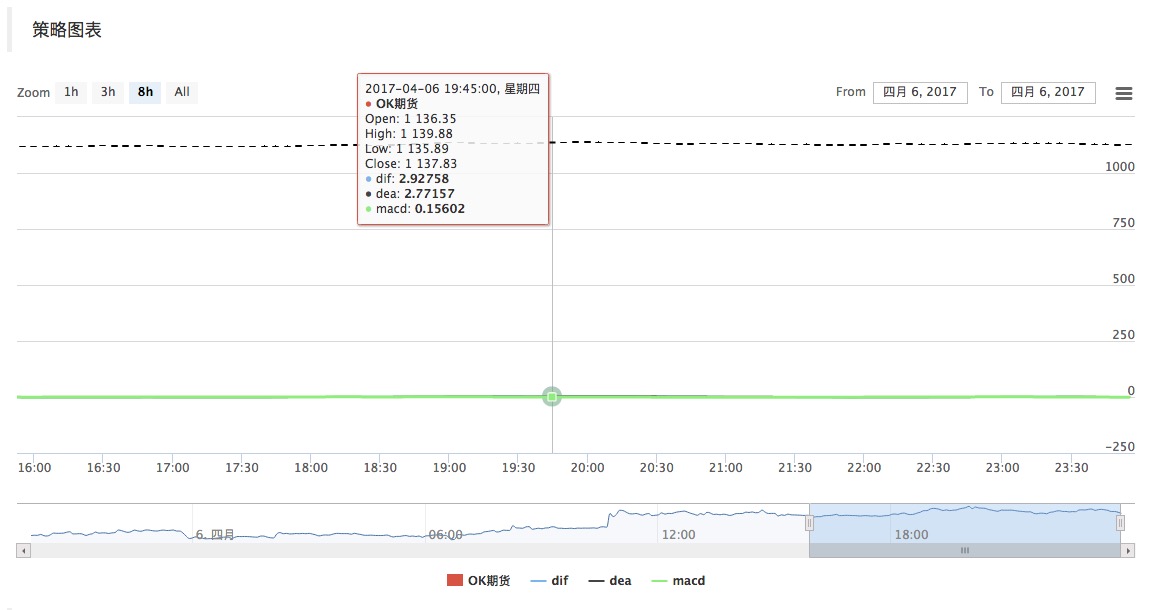
The reason is that the calculated MACD indicator value is too small, and the result is not shown locally (too small).
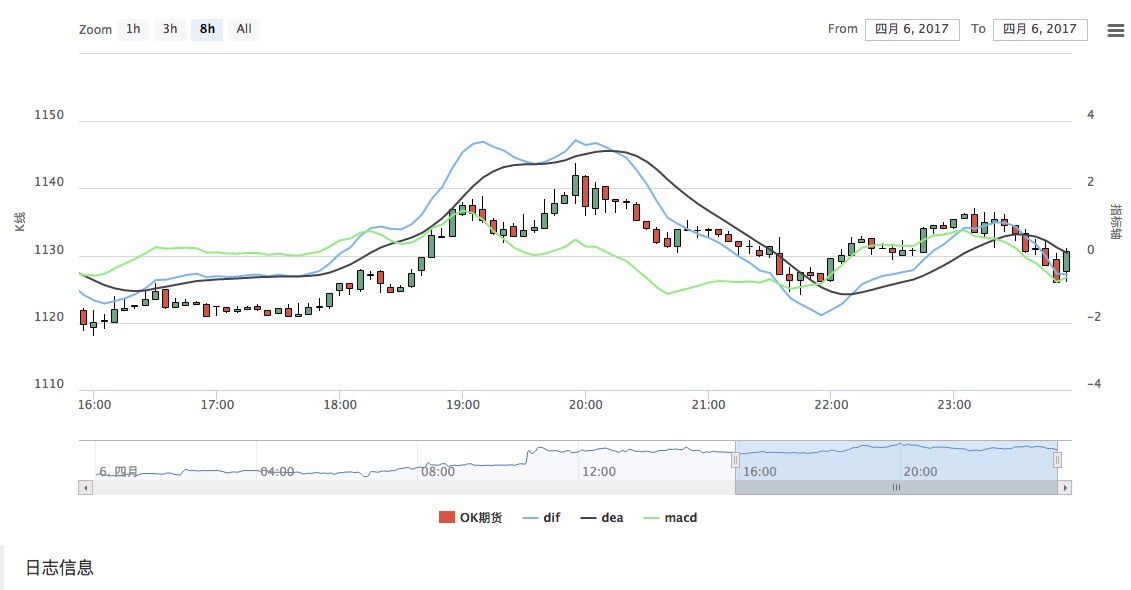
The solution is to add a Y-axis to the graph to display the indicator line separately, with the following example code:
var preTime = 0;
var ChartObj = null;
function main(){
    LogReset(1);
    ChartObj = Chart(null);
    ChartObj.reset();
    var records = null;
    var MACD = null;
    exchange.SetContractType("quarter");
    // Log(exchange.GetUSDCNY());
    // exchange.SetRate(exchange.GetUSDCNY());
    exchange.SetRate(1);
    ChartObj = $.GetCfg();

    ///*
    // 处理 指标轴------------------------
    ChartObj.yAxis = [{
            title: {text: 'K线'},//标题
            style: {color: '#4572A7'},//样式
            opposite: false  //生成右边Y轴
        },
        {
            title:{text: "指标轴"},
            opposite: true,  //生成右边Y轴  ceshi
        }
    ];
    // 初始化指标线
    while(!records || records.length < 30){
        records = _C(exchange.GetRecords);
        LogStatus("records.length:", records.length);
        Sleep(1000);
    }

    $.PlotRecords(records, 'OK期货');
    $.PlotLine('dif', 0, records[records.length - 1].Time);
    $.PlotLine('dea', 0, records[records.length - 1].Time);
    var chart = $.PlotLine('macd', 0, records[records.length - 1].Time);
    // 修改指标线 坐标轴Y轴
    for(var key in ChartObj.series){
        if(ChartObj.series[key].name == 'dif' || ChartObj.series[key].name == 'dea' || ChartObj.series[key].name == 'macd'){
            ChartObj.series[key].yAxis = 1;
        }
    }
    chart.update(ChartObj);
    chart.reset();
    //*/

    while(true){
        records = _C(exchange.GetRecords);
        if(records.length > 50){
            $.PlotRecords(records, 'OK期货');
            MACD = TA.MACD(records);
            var dif = MACD[0];
            var dea = MACD[1];
            var macd = MACD[2];
            if(preTime !== records[records.length - 1].Time){
                $.PlotLine('dif', dif[dif.length - 2], records[records.length - 2].Time);
                $.PlotLine('dea', dea[dea.length - 2], records[records.length - 2].Time);
                $.PlotLine('macd', macd[macd.length - 2], records[records.length - 2].Time);

                $.PlotLine('dif', dif[dif.length - 1], records[records.length - 1].Time);
                $.PlotLine('dea', dea[dea.length - 1], records[records.length - 1].Time);
                $.PlotLine('macd', macd[macd.length - 1], records[records.length - 1].Time);

                preTime = records[records.length - 1].Time;
            }else{
                $.PlotLine('dif', dif[dif.length - 1], records[records.length - 1].Time);
                $.PlotLine('dea', dea[dea.length - 1], records[records.length - 1].Time);
                $.PlotLine('macd', macd[macd.length - 1], records[records.length - 1].Time);
            }
        }
        LogStatus("records.length:", records.length, records[records.length - 1]);
        // Log(records[records.length - 1]);
        Sleep(1000);
    }
}
Remember to check when you test
Screenshot from the video:
- Voting is not a matter of time and strategy.
- Can you give an explanation of the parameters of the retest results?
- In the future, the rings will be fixed.
- The various strategies for stopping losses are detailed
- What does a more complete trading system include?
- From exploiting the vulnerabilities of the delivery system to the combination of cross-term leverage, this is how the good guys play copper.
- Meaning and simple application of futures holdings
- Holdings of futures
- Subjective and quantitative, synthetic and comparative
- Swing trading and swing trading
- Exchange API Special Issue Summary (Unfinished...)
- 7 issues to consider when dealing in virtual currency
- We hope to support the Bitmex platform
- Support for Coinbase and itbit
- MacD, please look at this.
- Indicator of the performance of trading algorithms -- Sharpe ratio
- A new kind of grid trading law
- I feel like you guys cut the cabbage, and I'm still holding the coin.
- Systematically learn regular expressions (a): basic essay
- Python and the Simple Bayes Application
penglihengThe week is all about writing code, and I haven't had the courage to do it for months after learning it.
penglihengThe problem is solved
penglihengThank you very much! https://dn-filebox.qbox.me/90d55ceceda193667f26b9b21d5122be8a2bcb2b.png Almost a week later, I finally wrote a simplified version of the visualization, with a 1% profit on the simple move, and a negative profit on the total move.
penglihengEvery time you open the page, you take a moment to look at the iconic data.
penglihengThank you very much, I'll calculate the net reload gain, but this policy graph can't save historical information, why does this graph initialize every time I refresh a page?
The Little Dream
The Little DreamOne week, fast, 666
The Little DreamChart bots on BotVS are permanently stored in a log database, on your hosts' premises, and if deleted, you can check to see if your code has initialized the deleted chart code.
The Little DreamWhat?