Supertendencia del punto de pivote
El autor:¿ Qué pasa?, Fecha: 2022-05-17 15:45:37Las etiquetas:El ejeEl ATR
Hola a todos,
Hay muchos tipos de SuperTrend alrededor. Recientemente pensé en una SuperTrend basada en Pivot Points luego escribí
La idea detrás de este script es encontrar puntos de pivote, calcular el promedio de ellos y como en supertrend creando bandas más altas/bajas por ATR. Como se puede ver en el algoritmo el script da peso a los puntos de pivote pasados, esto se hace para suavizar un poco.
Prueba posterior
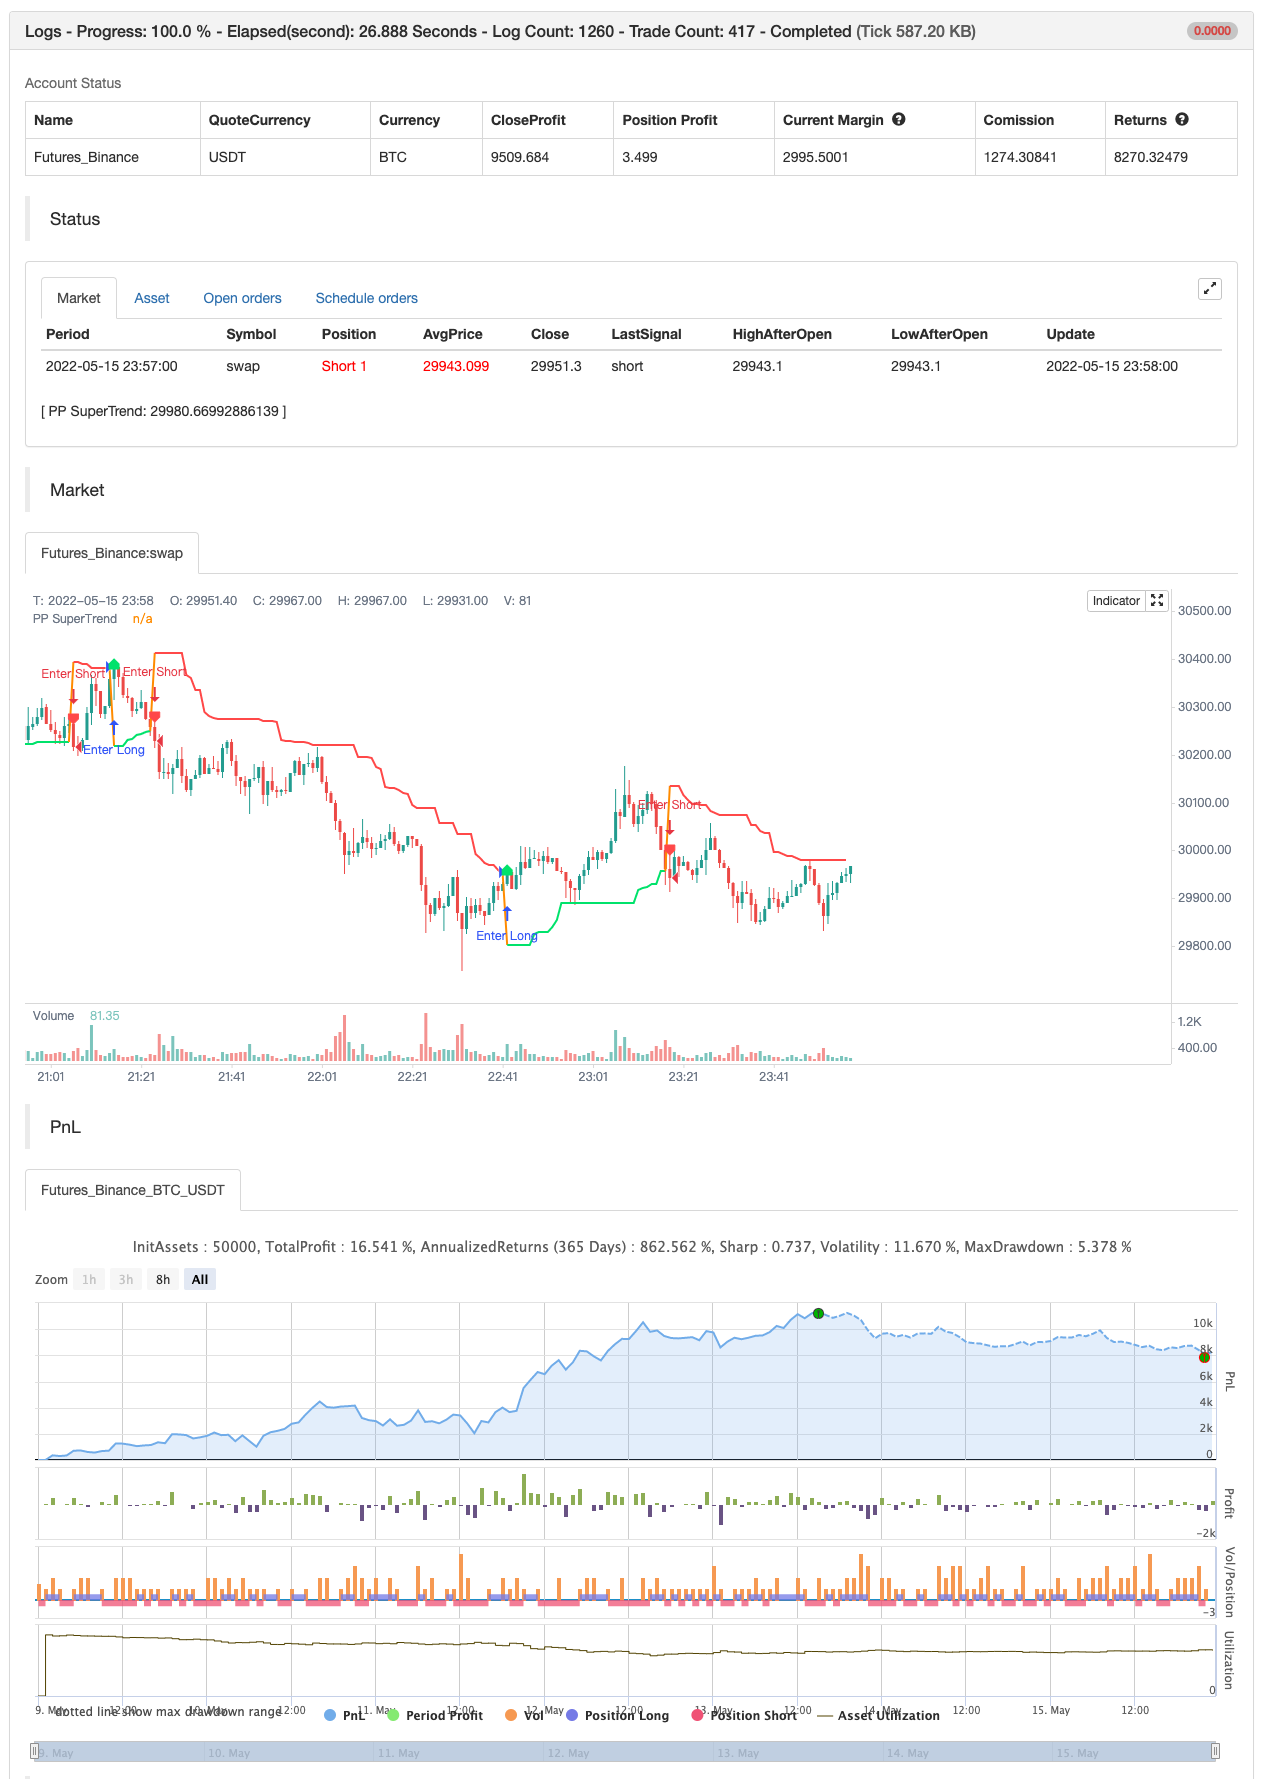
/*backtest
start: 2022-05-09 00:00:00
end: 2022-05-15 23:59:00
period: 1m
basePeriod: 1m
exchanges: [{"eid":"Futures_Binance","currency":"BTC_USDT"}]
*/

// This source code is subject to the terms of the Mozilla Public License 2.0 at https://mozilla.org/MPL/2.0/
// © LonesomeTheBlue

//@version=4
study("Pivot Point SuperTrend", overlay = true)
prd = input(defval = 3, title="Pivot Point Period", minval = 1, maxval = 50)
Factor=input(defval = 2, title = "ATR Factor", minval = 1, step = 0.1)
Pd=input(defval = 6, title = "ATR Period", minval=1)
showpivot = input(defval = false, title="Show Pivot Points")
showlabel = input(defval = true, title="Show Buy/Sell Labels")
showcl = input(defval = false, title="Show PP Center Line")
showsr = input(defval = false, title="Show Support/Resistance")

// get Pivot High/Low
float ph = pivothigh(prd, prd)
float pl = pivotlow(prd, prd)

// drawl Pivot Points if "showpivot" is enabled
plotshape(ph and showpivot, text="H",  style=shape.labeldown, color=na, textcolor=color.red, location=location.abovebar, transp=0, offset = -prd)
plotshape(pl and showpivot, text="L",  style=shape.labeldown, color=na, textcolor=color.lime, location=location.belowbar, transp=0, offset = -prd)

// calculate the Center line using pivot points
var float center = na
float lastpp = ph ? ph : pl ? pl : na
if lastpp
    if na(center)
        center := lastpp
    else
        //weighted calculation
        center := (center * 2 + lastpp) / 3

// upper/lower bands calculation
Up = center - (Factor * atr(Pd))
Dn = center + (Factor * atr(Pd))

// get the trend
float TUp = na
float TDown = na
Trend = 0
TUp := close[1] > TUp[1] ? max(Up, TUp[1]) : Up
TDown := close[1] < TDown[1] ? min(Dn, TDown[1]) : Dn
Trend := close > TDown[1] ? 1: close < TUp[1]? -1: nz(Trend[1], 1)
Trailingsl = Trend == 1 ? TUp : TDown

// plot the trend
linecolor = Trend == 1 and nz(Trend[1]) == 1 ? color.lime : Trend == -1 and nz(Trend[1]) == -1 ? color.red : na
plot(Trailingsl, color = linecolor ,  linewidth = 2, title = "PP SuperTrend")

plot(showcl ? center : na, color = showcl ? center < hl2 ? color.blue : color.red : na)

// check and plot the signals
bsignal = Trend == 1 and Trend[1] == -1
ssignal = Trend == -1 and Trend[1] == 1
plotshape(bsignal and showlabel ? Trailingsl : na, title="Buy", text="Buy", location = location.absolute, style = shape.labelup, size = size.tiny, color = color.lime, textcolor = color.black, transp = 0)
plotshape(ssignal and showlabel ? Trailingsl : na, title="Sell", text="Sell", location = location.absolute, style = shape.labeldown, size = size.tiny, color = color.red, textcolor = color.white, transp = 0)

//get S/R levels using Pivot Points
float resistance = na
float support = na
support := pl ? pl : support[1]
resistance := ph ? ph : resistance[1]

// if enabled then show S/R levels
plot(showsr and support ? support : na, color = showsr and support ? color.lime : na, style = plot.style_circles, offset = -prd)
plot(showsr and resistance ? resistance : na, color = showsr and resistance ? color.red : na, style = plot.style_circles, offset = -prd)

// alerts
alertcondition(Trend == 1 and Trend[1] == -1, title='Buy Signal', message='Buy Signal')
alertcondition(Trend == -1 and Trend[1] == 1, title='Sell Signal', message='Sell Signal')
alertcondition(change(Trend), title='Trend Changed', message='Trend Changed')


if Trend == 1 and Trend[1] == -1
    strategy.entry("Enter Long", strategy.long)
else if Trend == -1 and Trend[1] == 1
    strategy.entry("Enter Short", strategy.short)
Relacionados
- Estrategia de supertrend de pivote dinámico de Villa
- La progresión de Fibonacci con brechas
- Baguetas de granos
- Supertrend ATR con el seguimiento de la parada de pérdidas
- La máquina de moler
- Salida de la lámpara
- El uso de AlphaTrend
- Bloques de orden por eje
- Puntos de eje Alto Bajo Marco de tiempo Multi
- El valor de las emisiones de gases de efecto invernadero es el valor de las emisiones de gases de efecto invernadero.
Más.
- Ratio de energía direccional acelerada por volumen de RedK
- Donchian Breakout sin repintura
- Barras de impulso de RedK
- Super Salto Volver hacia atrás Banda de Bollinger
- Tendencia de Fukuiz
- El BOT de Johnny
- SSL híbrido
- Salida de la lámpara
- El RISOTTO
- Estrategia intradiaria de la nube de la EMA
- Supertrend+4 en movimiento
- ZigZag basado en el impulso
- VuManChu Cifrado B + Divergencias Estrategia
- Concepto SuperTendencia Doble
- El Super Scalper
- Pruebas de retroceso - Indicador
- Tendencia
- Es el asesino de los BTC.
- Modelo de alertas de ML
- La progresión de Fibonacci con brechas