Tendencia de Fukuiz
El autor:¿ Qué pasa?, Fecha: 2022-05-18 10:25:47Las etiquetas:El RMAIndicador de riesgo
Este indicador se basa en el RSI de 2 períodos diferentes.
# Una breve introducción a RSI # El índice de fuerza relativa (RSI) es un indicador de impulso utilizado en el análisis técnico que mide la magnitud de los cambios recientes de precios para evaluar las condiciones de sobrecompra o sobreventa en el precio de una acción u otro activo.
La interpretación y el uso tradicionales del RSI son que los valores de 70 o más indican que un valor se está volviendo sobrecomprado o sobrevalorado y puede estar preparado para una inversión de tendencia o un retroceso correctivo en el precio.
En este indicador Veo que puedes usar 2 RSI con diferentes períodos para sugerir tendencia alcista y tendencia bajista.
#Condiciones entre el cruce de RSI corto y largo# El cruce = tendencia alcista (zona azul) Crossunder = tendencia bajista (zona roja)
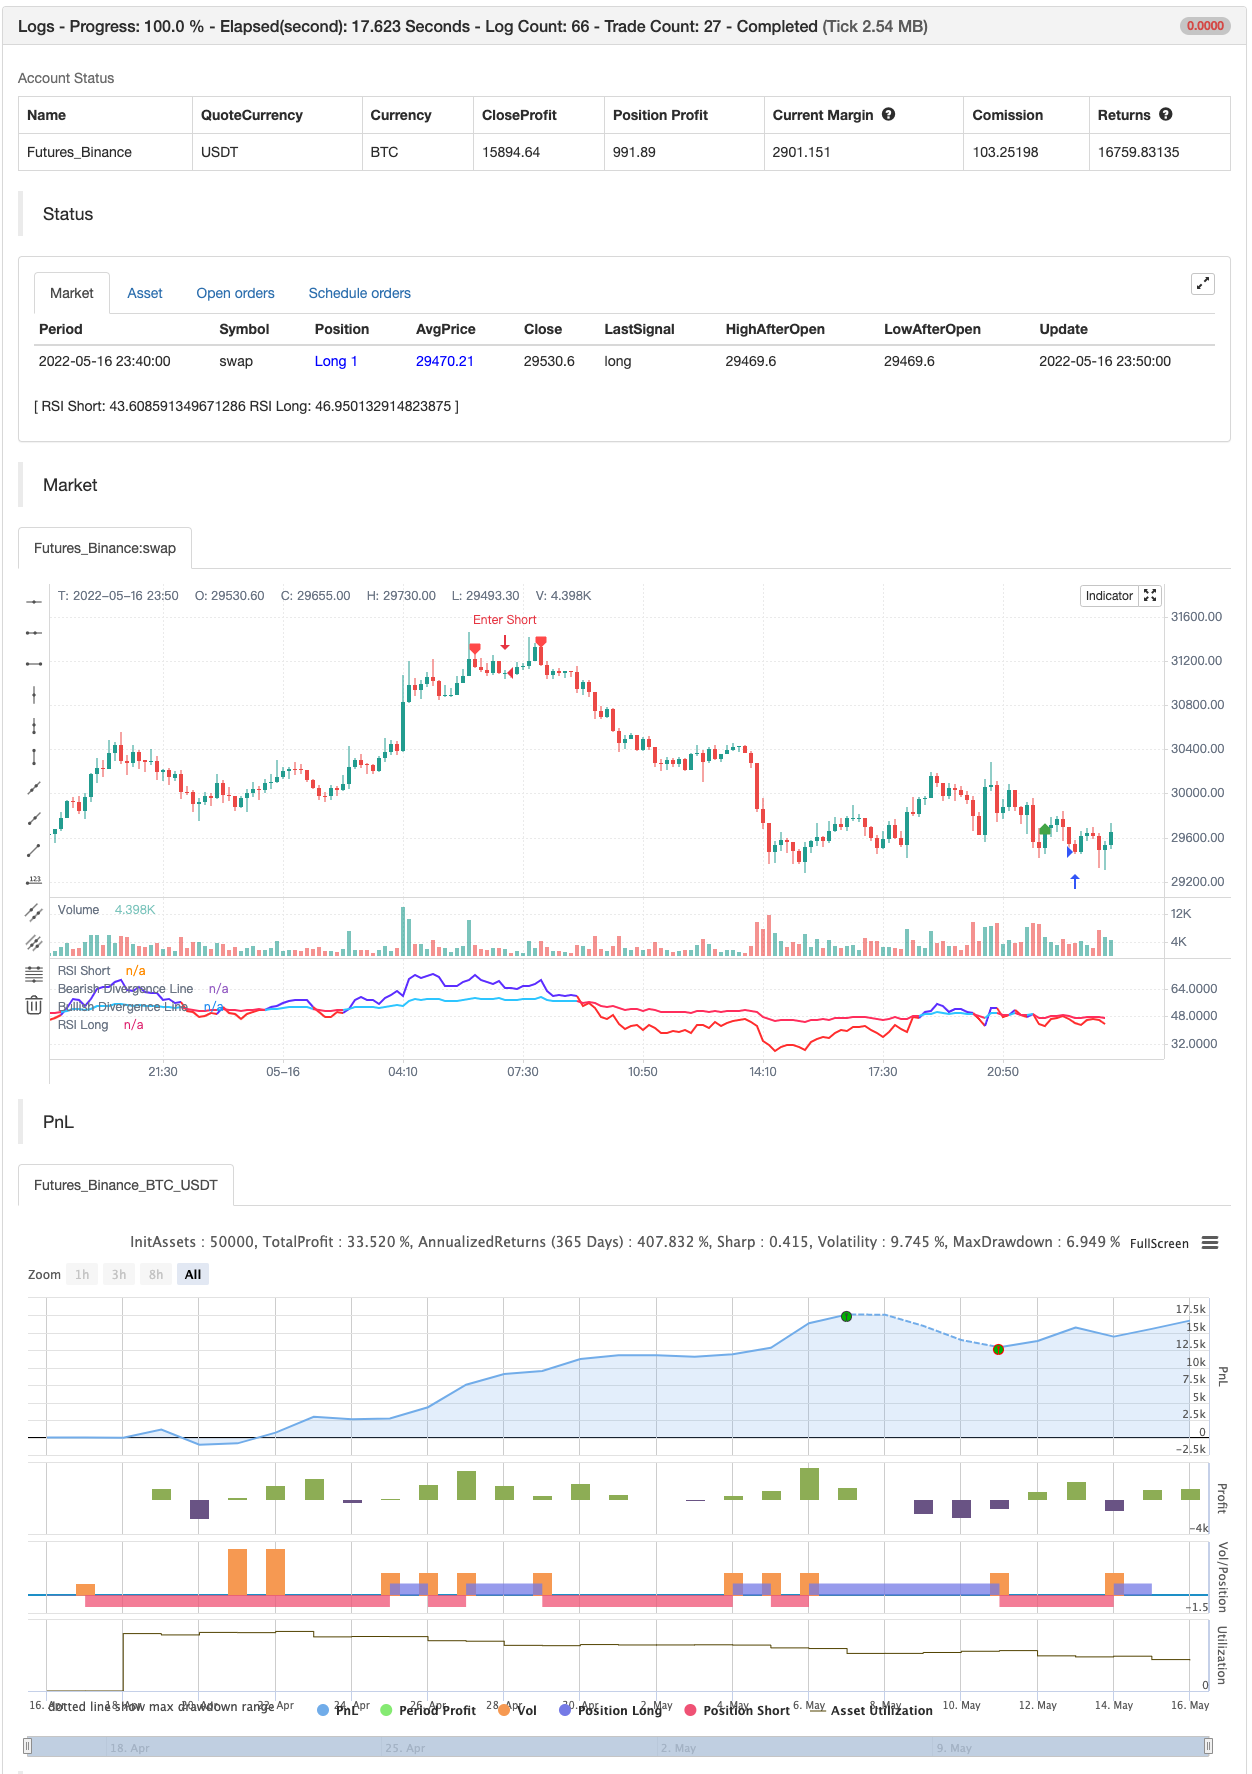
Pruebas de retroceso
/*backtest
start: 2022-04-17 00:00:00
end: 2022-05-16 23:59:00
period: 10m
basePeriod: 1m
exchanges: [{"eid":"Futures_Binance","currency":"BTC_USDT"}]
*/

//@version=5
//Fukuiz
indicator(title='Fukuiz Trend', shorttitle='Fukuiz Trend', format=format.price, precision=2, timeframe='')

//color//
colorwhite = #FFFFFF
colorblue = #6633FF
colorred = #FF3333
colorblue2 = #33CCFF
colorpink = #FF3366

//Fuction//
len = input.int(24, minval=1, title='RSI Short')
len2 = input.int(100, minval=1, title='RSI Long')
src = input(open, 'Source')
up = ta.rma(math.max(ta.change(src), 0), len)
down = ta.rma(-math.min(ta.change(src), 0), len)
up2 = ta.rma(math.max(ta.change(src), 0), len2)
down2 = ta.rma(-math.min(ta.change(src), 0), len2)
rsi = down == 0 ? 100 : up == 0 ? 0 : 100 - 100 / (1 + up / down)
rsi2 = down2 == 0 ? 100 : up2 == 0 ? 0 : 100 - 100 / (1 + up2 / down2)

Bullish = rsi > rsi2
Bearish = rsi < rsi2
Fukuizcolor = Bullish ? color.new(colorblue,0) : Bearish ? color.new(colorred,0) : na
Fukuizcolor2 = Bullish ? color.new(colorblue2,0) : Bearish ? color.new(colorpink,0) : na
Fukuizcolor3 = Bullish ? color.new(colorblue,75) : Bearish ? color.new(colorred,75) : na

//Plot//
l1 = plot(rsi, 'RSI Short', color=Fukuizcolor, linewidth=2, style=plot.style_line)
l2 = plot(rsi2, 'RSI Long', color=Fukuizcolor2, linewidth=2, style=plot.style_line)
band2 = hline(50, 'Middle Band', color=#FFCC99)
band1 = hline(70, 'Upper Band', color=#FFCC99)
band0 = hline(30, 'Lower Band', color=#FFCC99)
fill(band1, band0, color.new(#0946CA, 90), title='Background')
fill(l1, l2, color=Fukuizcolor3, title='Trend Background')


//DIVERGENCE//
lbR = input(title='Pivot Lookback Right', defval=5)
lbL = input(title='Pivot Lookback Left', defval=5)
rangeUpper = input(title='Max of Lookback Range', defval=60)
rangeLower = input(title='Min of Lookback Range', defval=5)
plotBull = input(title='Bullish Divergence', defval=true)
plotBear = input(title='Bearish Divergence', defval=true)
bearColor = color.red
bullColor = color.green
hiddenBullColor = color.new(color.green, 80)
hiddenBearColor = color.new(color.red, 80)
textColor = color.white
noneColor = color.new(color.white, 100)
osc = ta.rsi(src, len)

plFound = na(ta.pivotlow(osc, lbL, lbR)) ? false : true
phFound = na(ta.pivothigh(osc, lbL, lbR)) ? false : true
_inRange(cond) =>
    bars = ta.barssince(cond == true)
    rangeLower <= bars and bars <= rangeUpper

oscHL = osc[lbR] > ta.valuewhen(plFound, osc[lbR], 1) and _inRange(plFound[1])
priceLL = low[lbR] < ta.valuewhen(plFound, low[lbR], 1)
bullCond = plotBull and priceLL and oscHL and plFound

plot(plFound ? osc[lbR] : na, offset=-lbR, title='Bullish Divergence Line', linewidth=2, color=bullCond ? bullColor : noneColor,display=display.none)

plotshape(bullCond ? osc[lbR] : na, offset=-lbR, title='Bullish Divergence Label', text=' Bull ', style=shape.labelup, location=location.absolute, color=color.new(bullColor, 0), textcolor=color.new(textColor, 0))

oscLH = osc[lbR] < ta.valuewhen(phFound, osc[lbR], 1) and _inRange(phFound[1])
priceHH = high[lbR] > ta.valuewhen(phFound, high[lbR], 1)
bearCond = plotBear and priceHH and oscLH and phFound

plot(phFound ? osc[lbR] : na, offset=-lbR, title='Bearish Divergence Line', linewidth=2, color=bearCond ? bearColor : noneColor,display=display.none)

plotshape(bearCond ? osc[lbR] : na, offset=-lbR, title='Bearish Divergence Label', text=' Bear ', style=shape.labeldown, location=location.absolute, color=color.new(bearColor, 0), textcolor=color.new(textColor, 0))


if bullCond
    strategy.entry("Enter Long", strategy.long)
else if bearCond
    strategy.entry("Enter Short", strategy.short)
- Super Scalper - 5 Min 15 Min
- El valor de las operaciones de venta de valores de mercado se calculará en función de las operaciones de venta de valores.
- RSI - Señales de compra y venta
- Estrategias de ajuste estadístico del RSI
- Estrategia del índice de fortaleza relativa del RSI
- RSI por zdmre
- Las operaciones de las entidades de crédito se clasifican en el modelo de referencia.
- TMA-herencia
- SuperTREX
- Bollinger + RSI, doble estrategia v1.1
- Indicador personalizado CM MACD - Marco de tiempo múltiple - V2
- Línea de captura
- 2 Detección de la dirección del color de la media móvil
- El valor de las pérdidas de crédito se calculará en función de las pérdidas de crédito.
- La estrategia de compra y venta depende de AO+Stoch+RSI+ATR
- El valor de las emisiones de gases de efecto invernadero
- Ratio de energía direccional acelerada por volumen de RedK
- Donchian Breakout sin repintura
- Barras de impulso de RedK
- Super Salto Volver hacia atrás Banda de Bollinger
- El BOT de Johnny
- SSL híbrido
- Salida de la lámpara
- El RISOTTO
- Estrategia intradiaria de la nube de la EMA
- Supertendencia del punto de pivote
- Supertrend+4 en movimiento
- ZigZag basado en el impulso
- VuManChu Cifrado B + Divergencias Estrategia
- Concepto SuperTendencia Doble