Estrategia de índice de reversión de impulso

Descripción general
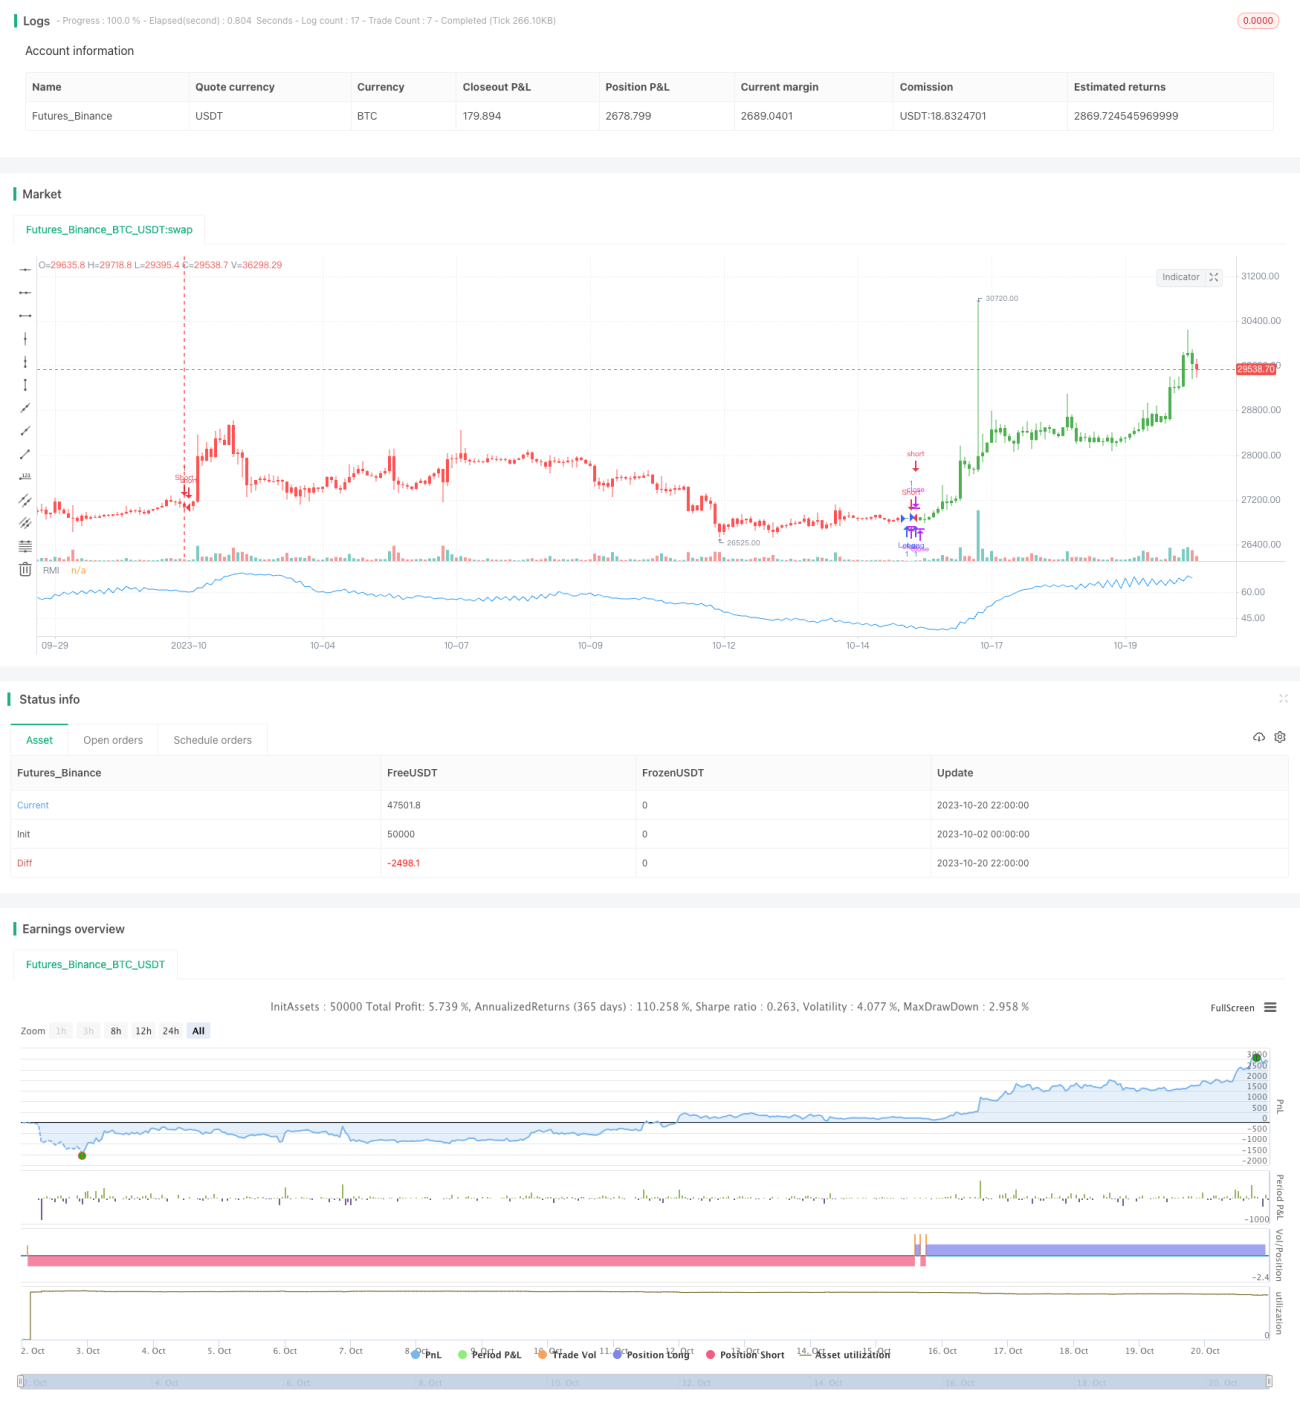
La estrategia del índice de movimiento relativo (RMI) es una estrategia de mejora basada en el índice de movimiento. La estrategia determina si el mercado está sobrecomprado o sobrevendido al calcular la dinámica de los cambios de precio durante un período de tiempo para capturar oportunidades de movimiento.
Principio de estrategia
La fórmula de cálculo de la estrategia RMI es la siguiente:
javascript
xMom = xPrice - xPrice[Length] //计算Length周期内的价格变动
xMU = 如果xMom >= 0:之前xMU减去xMU/Length加上xMom;否则:之前xMU
xMD = 如果xMom <= 0:之前xMD减去xMD/Length加上xMom的绝对值;否则:0
RM = xMU / xMD
RMI = 100 * (RM / (1 + RM))
La estrategia primero calcula el cambio de precio xMom en el período de Length. Si xMom> = 0, el precio sube, entonces xMU acumula xMom; si xMom < 0, el precio baja, entonces xMD acumula xMom. El RM es la relación entre xMU y xMD, que representa la fuerza de la caída.
Cuando el RMI está por encima de la SelZone, significa sobrecomprar y cerrar; cuando el RMI está por debajo de la BuyZone, significa sobrevender y hacer más.
Ventajas estratégicas
- El índice RMI es más sensible que el RSI y es capaz de capturar oportunidades de reversión de precios antes.
- El RMI mide la fuerza de la oscilación y no se ve afectado por la oscilación.
- El RMI es un indicador más preciso de sobrecompra y sobreventa basado en la dinámica.
Riesgo estratégico
- Al igual que otras estrategias de reversión, la estrategia RMI corre el riesgo de ser aprovechada.
- Los parámetros de RMI necesitan ser optimizados para diferentes variedades, de lo contrario el efecto puede ser negativo.
- Se debe establecer un umbral razonable de sobrecompra y sobreventa, de lo contrario se generan demasiadas señales falsas.
Se puede reducir el riesgo al relajar adecuadamente los puntos de parada, optimizar la combinación de parámetros y combinar con estrategias de tendencia.
Optimización de la estrategia
Las estrategias RMI se pueden optimizar en los siguientes aspectos:
- Optimice el parámetro Length para seleccionar la longitud de ciclo que maximiza los beneficios de la estrategia.
- Optimizar el umbral de sobrecompra y sobreventa para reducir la probabilidad de señales falsas.
- Aumentar el mecanismo de suspensión de pérdidas y controlar las pérdidas individuales.
- La combinación con el seguimiento de tendencias o la estrategia de línea uniforme aumenta la tasa de éxito.
- Seleccionar el momento de negociación adecuado según las características de las diferentes variedades para mejorar la estabilidad de la estrategia.
Resumir
La estrategia RMI puede capturar oportunidades de reajuste de la línea corta mediante la medición de la variación de la dinámica de los precios y la operación de reversión. La estrategia RMI es más sensible y no se ve afectada por las oscilaciones en comparación con la estrategia RSI.
/*backtest
start: 2023-10-02 00:00:00
end: 2023-10-21 00:00:00
period: 2h
basePeriod: 15m
exchanges: [{"eid":"Futures_Binance","currency":"BTC_USDT"}]
*/

//@version=2
////////////////////////////////////////////////////////////
//  Copyright by HPotter v1.0 19/10/2017
// The Relative Momentum Index (RMI) was developed by Roger Altman. Impressed - 1