Estrategia de trading con media móvil exponencial triple y media móvil exponencial estocástica
Descripción general
La estrategia es una estrategia de seguimiento de tendencias que combina un indicador de promedio móvil de triple índice y un indicador de promedio móvil liso de índice aleatorio para generar una señal de negociación. Cuando el promedio móvil rápido atraviesa el promedio móvil rápido, el promedio móvil rápido atraviesa el promedio móvil lento; cuando el promedio móvil rápido atraviesa el promedio móvil rápido y el promedio móvil lento atraviesa el promedio móvil lento.
El principio
El uso de promedios móviles de índice triples de 8, 14 y 50 días. Cuando el promedio móvil de índice de 14 días se cruza sobre el promedio móvil de índice de 8 días, se produce una señal de mira múltiple cuando el promedio móvil de índice de 14 días se cruza sobre el promedio móvil de índice de 50 días.
El uso de un indicador de promedio móvil liso de índice aleatorio (Stochastic RSI) como indicador auxiliar de juicio. Específicamente: primero se calcula el RSI de 14 días, luego se calcula el indicador estocástico sobre la base del indicador RSI, y finalmente se obtiene la línea K para el promedio móvil simple de 3 días y la línea D para el promedio móvil simple de 3 días.
En la generación de señales de negociación, si el precio está por encima de la media móvil del índice de 8 días, la entrada es más alta; si el precio está por debajo de la media móvil del índice de 8 días, la entrada es baja.
El stop loss está situado por encima o por debajo del precio de entrada a una distancia de 1 ATR. El stop loss está situado por encima o por debajo del precio de entrada a una distancia de 4 ATR.
Las ventajas
Los promedios móviles como indicadores básicos permiten un seguimiento eficaz de las tendencias del mercado. Los promedios móviles de triple índice se utilizan en combinación con varios períodos para garantizar la sensibilidad a las tendencias a corto y mediano plazo.
La adición del RSI estocástico como indicador auxiliar de juicio, puede filtrar las señales falsas y mejorar la precisión de la entrada.
La configuración de la posición del stop loss en función del ATR permite seguir de forma dinámica la volatilidad del mercado y evitar que el stop loss sea demasiado grande o demasiado pequeño.
La configuración de los parámetros de la estrategia es razonable, y se desempeña de manera excelente en las grandes tendencias. La retirada es pequeña, la ganancia es más uniforme y es adecuada para operaciones de línea larga.
El riesgo
Las estrategias de combinación de múltiples indicadores aumentan el riesgo de reversión. Cuando las medias móviles y el RSI estocástico emiten señales opuestas, puede producirse un error de señal de negociación. En este caso, es necesario prestar atención a la tendencia del precio en sí.
La configuración de los paros y paradas es más conservadora, y puede ser interrumpida por una ruptura en el momento de una fuerte fluctuación en el mercado, perdiendo la oportunidad de una tendencia. En este caso, se puede ajustar adecuadamente el parámetro ATR o aumentar el múltiplo del parón de los parados.
Debido al uso de la media móvil triple, cuando la línea rápida y la línea de velocidad media se invierten, hay un cierto retraso. En este caso, es necesario prestar atención a si el precio se invierten para decidir si entrar en juego.
Esta estrategia se aplica principalmente a situaciones de tendencia, que no funcionan bien en la consolidación de la situación. En este caso, se puede considerar la optimización de los parámetros periódicos de las medias móviles o el uso de otros indicadores de determinación.
Optimización
Se puede considerar la inclusión de otros indicadores como el MACD para optimizar aún más el tiempo de entrada. También se puede probar una combinación de promedios móviles de diferentes parámetros.
Se pueden optimizar los parámetros de la comprobación de ATR. Por ejemplo, se puede ajustar el stop loss de 1 ATR a 1.5 ATR y el stop loss de 4 ATR a 3 ATR para ver si se obtienen mejores ganancias.
Se puede probar usando solo las medias móviles y eliminando el indicador Stochastic RSI para ver si se puede filtrar más ruido y obtener ganancias más estables.
Se puede considerar la adición de más condiciones para juzgar las tendencias, como el aumento de los indicadores de volumen de transacciones, para asegurar que se opere en una tendencia a gran escala.
Resumir
La estrategia combina el uso de las medias móviles del triple índice y el indicador Stochastic RSI para determinar la dirección de la tendencia. Las señales de entrada son más estrictas y pueden reducir eficazmente los intercambios sin sentido. La configuración de stop loss sigue el ATR dinámicamente, lo que hace que los parámetros de la estrategia sean adaptables.
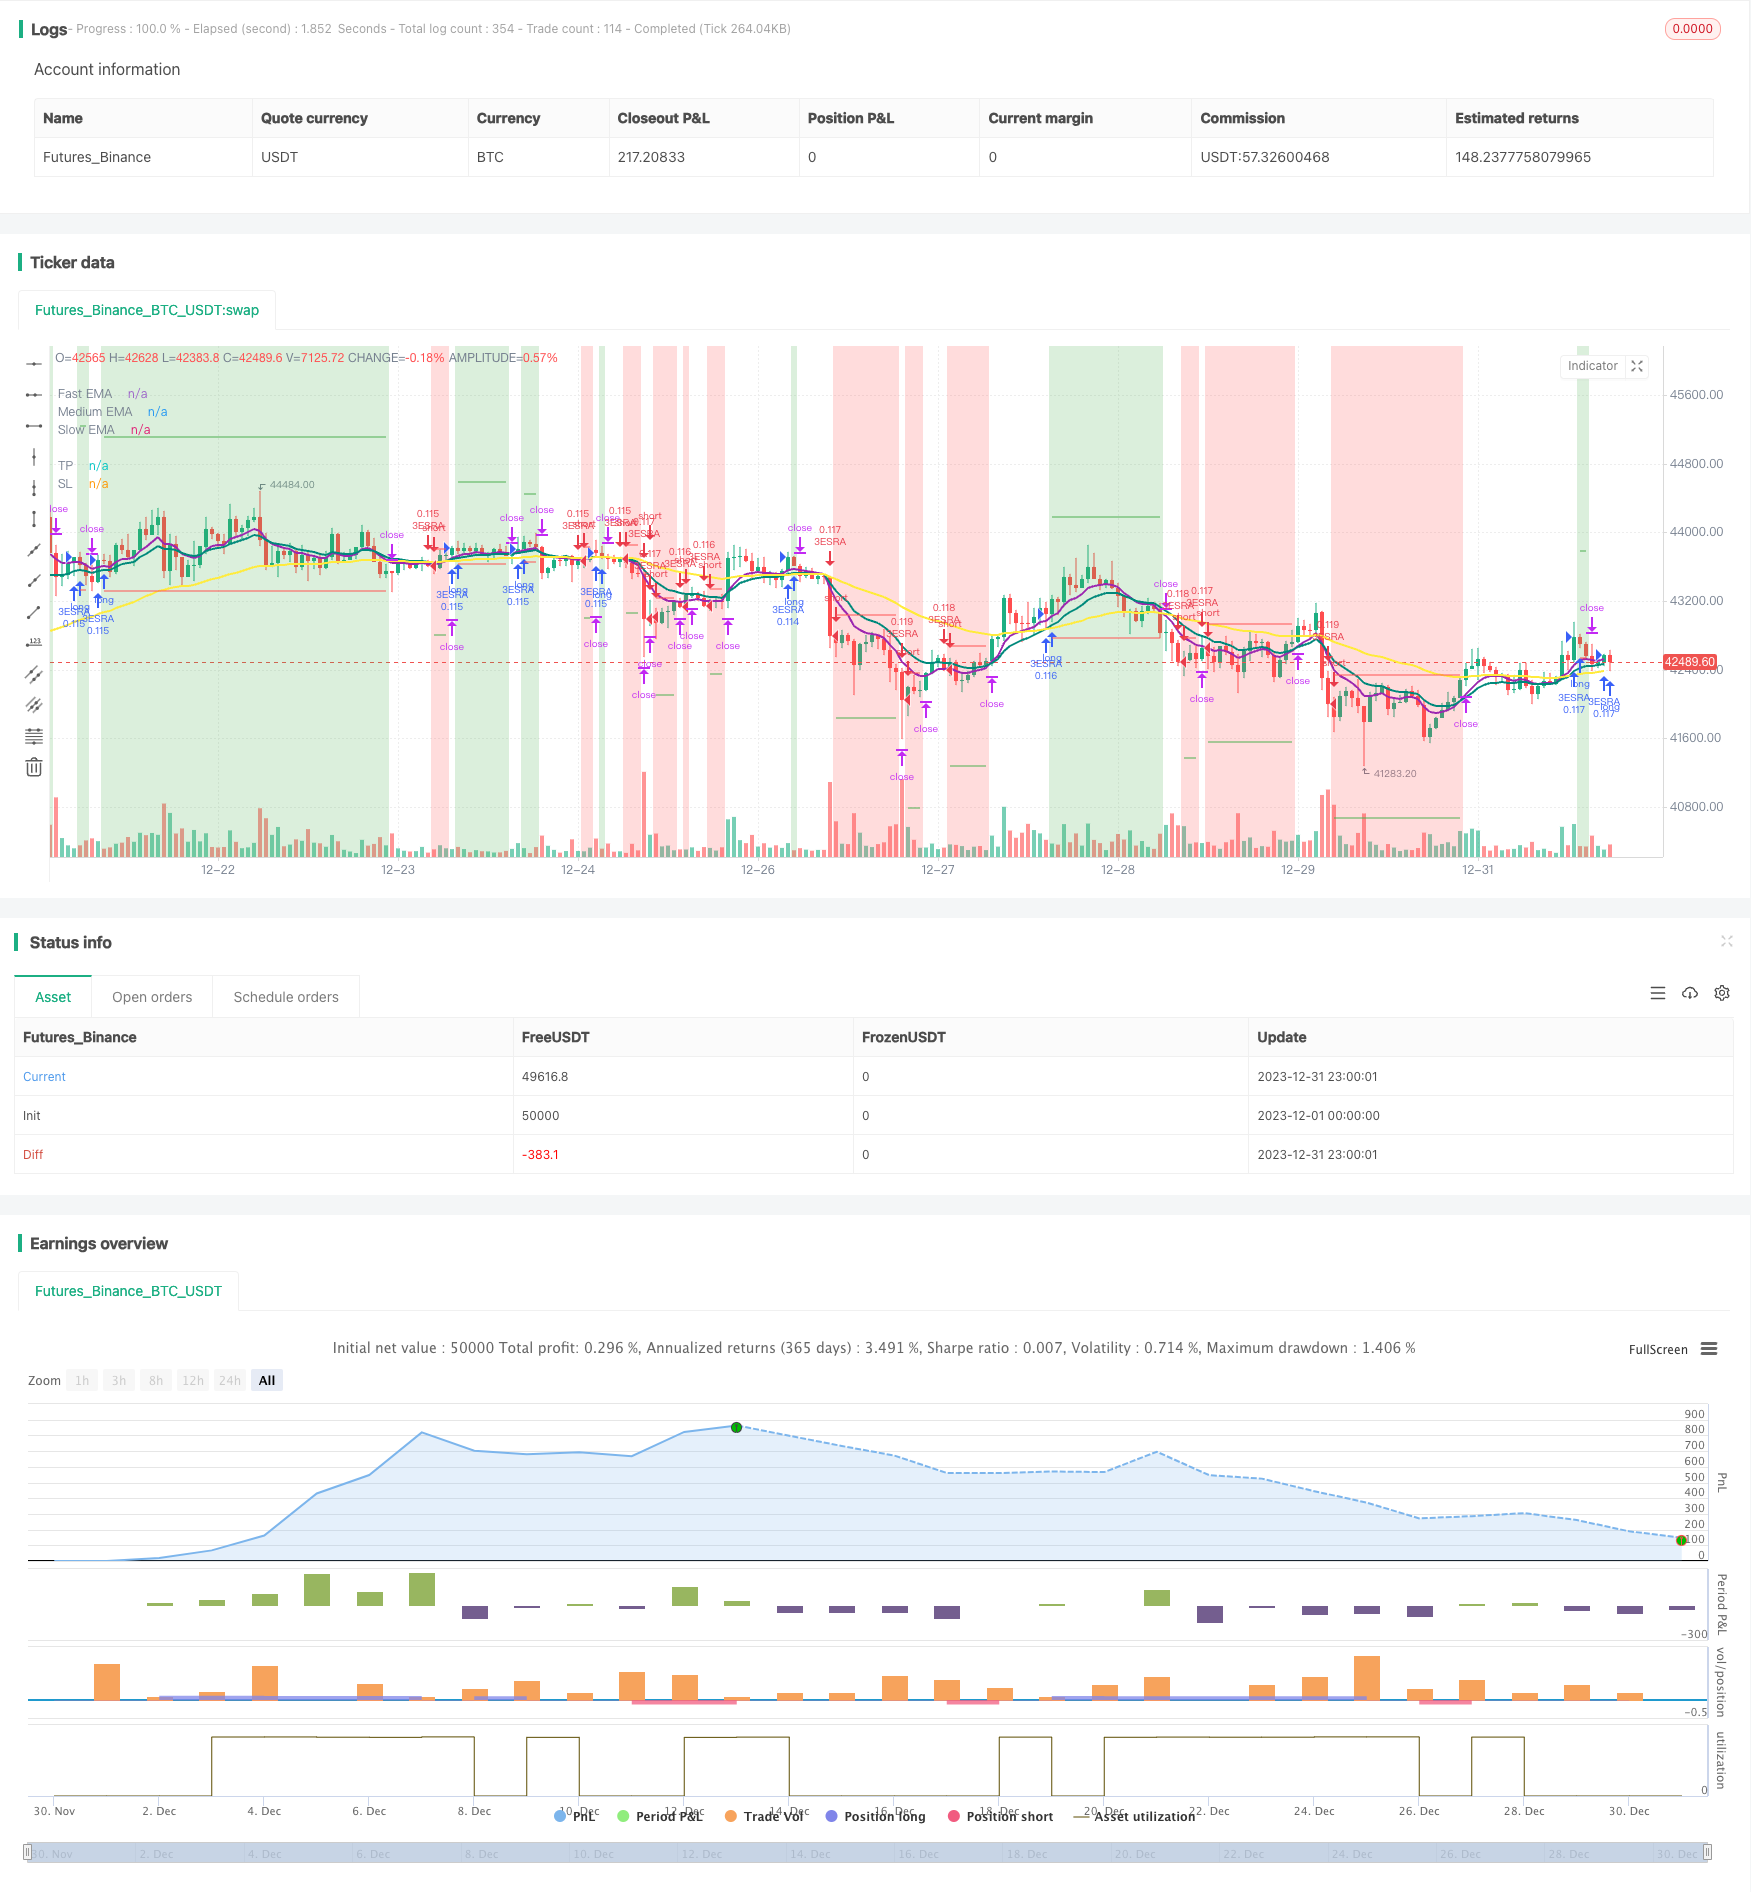
/*backtest
start: 2023-12-01 00:00:00
end: 2023-12-31 23:59:59
period: 1h
basePeriod: 15m
exchanges: [{"eid":"Futures_Binance","currency":"BTC_USDT"}]
*/

//              3ESRA
//              v0.2a

// Coded by Vaida Bogdan

// 3ESRA consists of a 3 EMA cross + a close above (for longs) the quickest EMA
// or below (for shorts). Note that I've deactivated the RSI Cross Over/Under
// (you can modify the code and activate it). The strategy also uses a stop loss
// that's at 1 ATR distance from the entry price and a take profit that's at
// 4 times the ATR distance from the entry price.

// Feedback:
// Tested BTCUSDT Daily
// 1. Stoch-RSI makes you miss opportunities.
// 2. Changing RR to 4:1 times ATR works better.

//@version=4
strategy(title="3 EMA + Stochastic RSI + ATR", shorttitle="3ESRA", overlay=true, pyramiding=1,
     process_orders_on_close=true, calc_on_every_tick=true,
     initial_capital=1000, currency = currency.USD, default_qty_value=10,
     default_qty_type=strategy.percent_of_equity,
     commission_type=strategy.commission.percent, commission_value=0.1, slippage=2)

startDate = input(title="Start Date", type=input.integer,
     defval=1, minval=1, maxval=31, group="Backtesting range")
startMonth = input(title="Start Month", type=input.integer,
     defval=1, minval=1, maxval=12, group="Backtesting range")
startYear = input(title="Start Year", type=input.integer,
     defval=1900, minval=1800, maxval=2100, group="Backtesting range")
endDate = input(title="End Date", type=input.integer,
     defval=1, minval=1, maxval=31, group="Backtesting range")
endMonth = input(title="End Month", type=input.integer,
     defval=1, minval=1, maxval=12, group="Backtesting range")
endYear = input(title="End Year", type=input.integer,
     defval=2040, minval=1800, maxval=2100, group="Backtesting range")

// Date range filtering
inDateRange = (time >= timestamp(syminfo.timezone, startYear, startMonth, startDate, 0, 0)) and
     (time < timestamp(syminfo.timezone, endYear, endMonth, endDate, 23, 59))

fast = input(8, minval=8, title="Fast EMA", group="EMAs")
medium = input(14, minval=8, title="Medium EMA", group="EMAs")
slow = input(50, minval=8, title="Slow EMA", group="EMAs")
src = input(close, title="Source")

smoothK = input(3, "K", minval=1, group="Stoch-RSI", inline="K&D")
smoothD = input(3, "D", minval=1, group="Stoch-RSI", inline="K&D")
lengthRSI = input(14, "RSI Length", minval=1, group="Stoch-RSI", inline="length")
lengthStoch = input(14, "Stochastic Length", minval=1, group="Stoch-RSI", inline="length")
rsiSrc = input(close, title="RSI Source", group="Stoch-RSI")

length = input(title="Length", defval=14, minval=1, group="ATR")
smoothing = input(title="Smoothing", defval="RMA", options=["RMA", "SMA", "EMA", "WMA"], group="ATR")

// EMAs
fastema = ema(src, fast)
mediumema = ema(src, medium)
slowema = ema(src, slow)

// S-RSI
rsi1 = rsi(rsiSrc, lengthRSI)
k = sma(stoch(rsi1, rsi1, rsi1, lengthStoch), smoothK)
d = sma(k, smoothD)
sRsiCrossOver = k[1] < d[1] and k > d
sRsiCrossUnder = k[1] > d[1] and k < d

// ATR
ma_function(source, length) =>
	if smoothing == "RMA"
		rma(source, length)
	else
		if smoothing == "SMA"
			sma(source, length)
		else
			if smoothing == "EMA"
				ema(source, length)
			else
				wma(source, length)
atr = ma_function(tr(true), length)

// Trading Logic
longCond1 = (fastema > mediumema) and (mediumema > slowema)
longCond2 = true
// longCond2 = sRsiCrossOver
longCond3 = close > fastema
longCond4 = strategy.position_size <= 0
longCond = longCond1 and longCond2 and longCond3 and longCond4 and inDateRange

shortCond1 = (fastema < mediumema) and (mediumema < slowema)
shortCond2 = true
// shortCond2 = sRsiCrossUnder
shortCond3 = close < fastema
shortCond4 = strategy.position_size >= 0
shortCond = shortCond1 and shortCond2 and shortCond3 and shortCond4 and inDateRange

var takeProfit = float(na), var stopLoss = float(na)
if longCond and strategy.position_size <= 0
    takeProfit := close + 4*atr
    stopLoss := close - 1*atr
    // takeProfit := close + 2*atr
    // stopLoss := close - 3*atr

else if shortCond and strategy.position_size >= 0
    takeProfit := close - 4*atr
    stopLoss := close + 1*atr
    // takeProfit := close - 2*atr
    // stopLoss := close + 3*atr

// Strategy calls
strategy.entry("3ESRA", strategy.long, comment="Long", when=longCond and strategy.position_size <= 0)
strategy.entry("3ESRA", strategy.short, comment="Short", when=shortCond and strategy.position_size >= 0)
strategy.exit(id="TP-SL", from_entry="3ESRA", limit=takeProfit, stop=stopLoss)
if (not inDateRange)
    strategy.close_all()

// Plot EMAs
plot(fastema, color=color.purple, linewidth=2, title="Fast EMA")
plot(mediumema, color=color.teal, linewidth=2, title="Medium EMA")
plot(slowema, color=color.yellow, linewidth=2, title="Slow EMA")
// Plot S-RSI
// plotshape((strategy.position_size > 0) ? na : sRsiCrossOver, title="StochRSI Cross Over", style=shape.triangleup, location=location.belowbar, color=color.teal, text="SRSI", size=size.small)
// Plot trade
bgcolor(strategy.position_size > 0 ? color.new(color.green, 75) : strategy.position_size < 0 ? color.new(color.red,75) : color(na))
// Plot Strategy
plot((strategy.position_size != 0) ? takeProfit : na, style=plot.style_linebr, color=color.green, title="TP")
plot((strategy.position_size != 0) ? stopLoss : na, style=plot.style_linebr, color=color.red, title="SL")