Supertendance du point pivot
Auteur:ChaoZhang est là., Date: 2022-05-17 15h45: 37Les étiquettes:Le pivotATR
Bonjour à tous,
Il y a beaucoup de types de SuperTrend autour. Récemment, j'ai pensé à une SuperTrend basée sur Pivot Points puis j'ai écrit
Comme vous pouvez le voir dans l'algorithme, le script donne du poids aux points de pivot passés, cela est fait pour lisser un peu.
test de retour
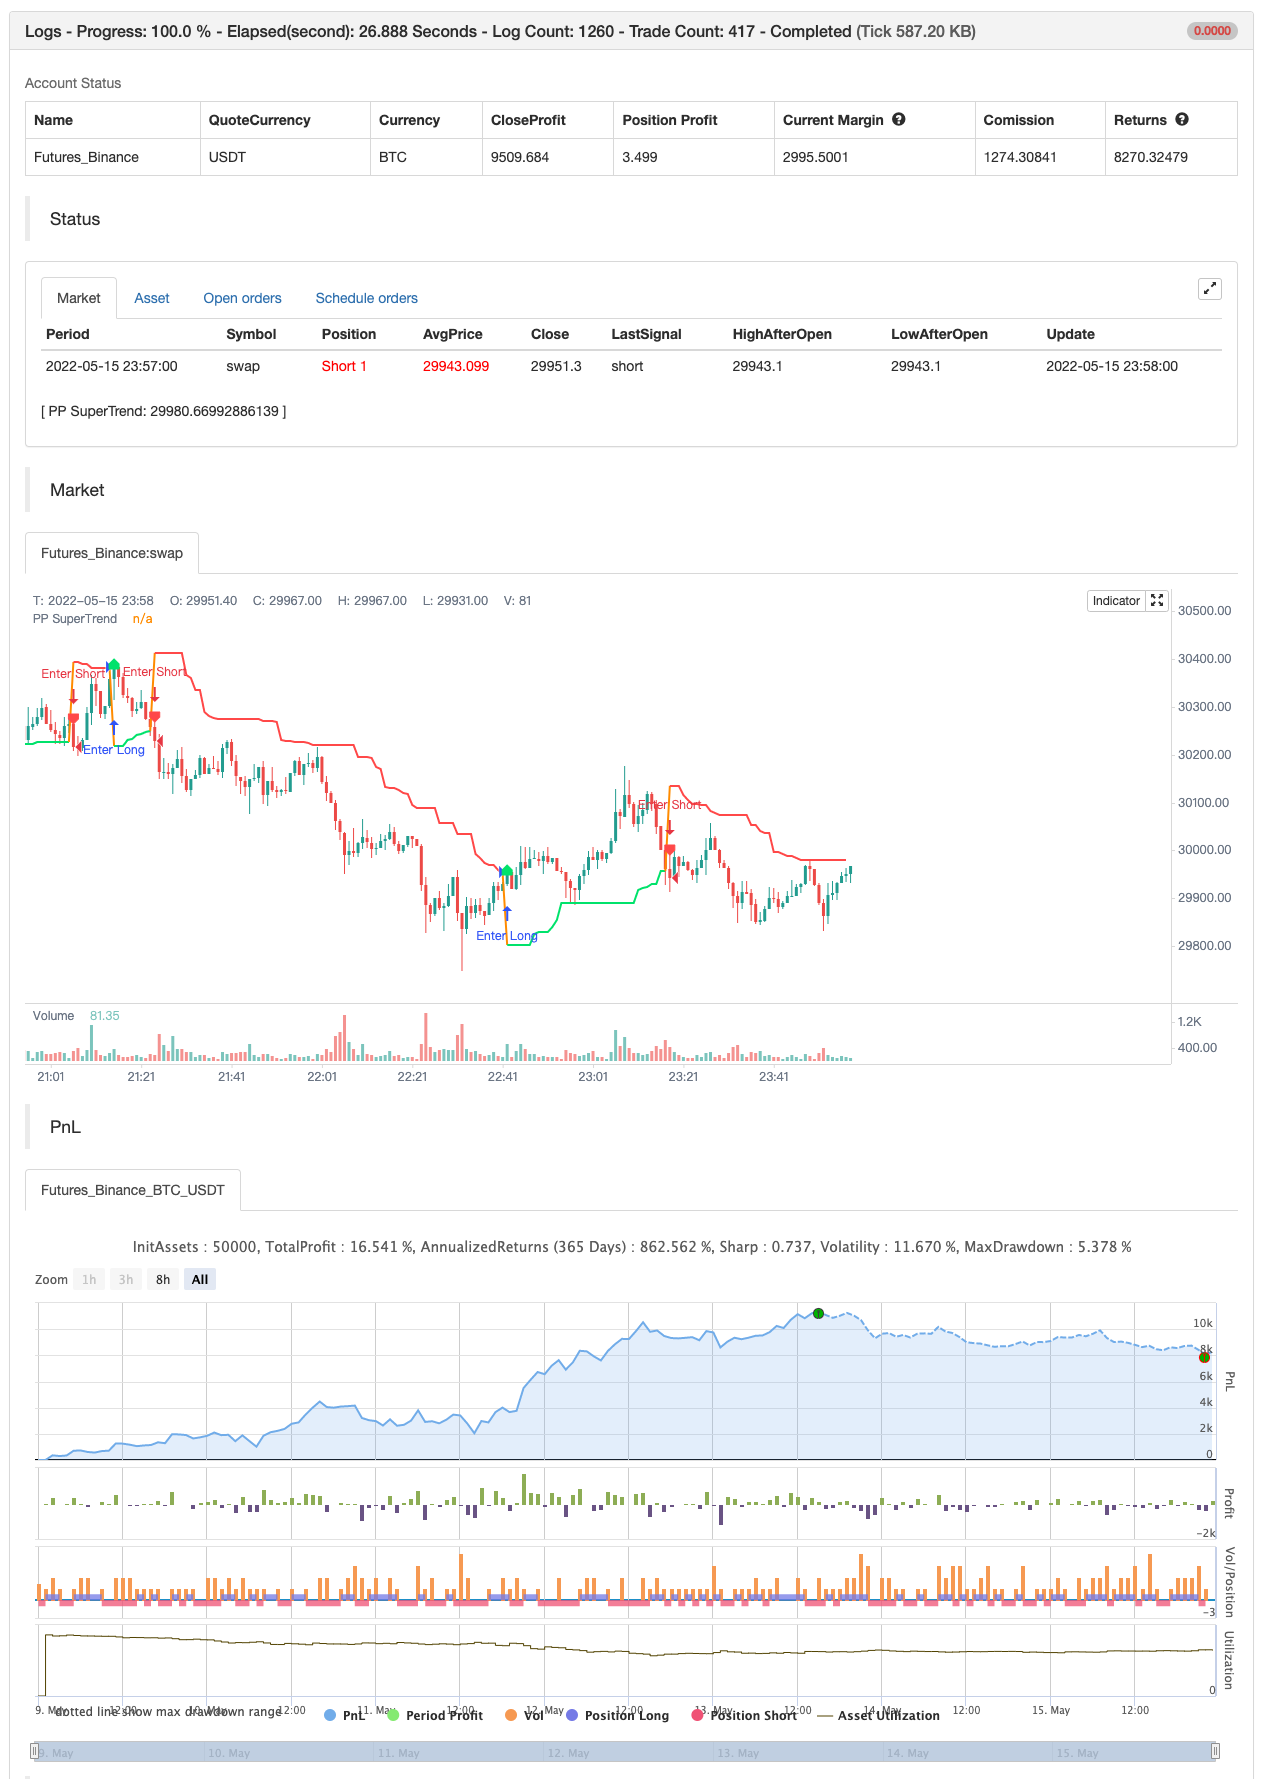
/*backtest
start: 2022-05-09 00:00:00
end: 2022-05-15 23:59:00
period: 1m
basePeriod: 1m
exchanges: [{"eid":"Futures_Binance","currency":"BTC_USDT"}]
*/

// This source code is subject to the terms of the Mozilla Public License 2.0 at https://mozilla.org/MPL/2.0/
// © LonesomeTheBlue

//@version=4
study("Pivot Point SuperTrend", overlay = true)
prd = input(defval = 3, title="Pivot Point Period", minval = 1, maxval = 50)
Factor=input(defval = 2, title = "ATR Factor", minval = 1, step = 0.1)
Pd=input(defval = 6, title = "ATR Period", minval=1)
showpivot = input(defval = false, title="Show Pivot Points")
showlabel = input(defval = true, title="Show Buy/Sell Labels")
showcl = input(defval = false, title="Show PP Center Line")
showsr = input(defval = false, title="Show Support/Resistance")

// get Pivot High/Low
float ph = pivothigh(prd, prd)
float pl = pivotlow(prd, prd)

// drawl Pivot Points if "showpivot" is enabled
plotshape(ph and showpivot, text="H",  style=shape.labeldown, color=na, textcolor=color.red, location=location.abovebar, transp=0, offset = -prd)
plotshape(pl and showpivot, text="L",  style=shape.labeldown, color=na, textcolor=color.lime, location=location.belowbar, transp=0, offset = -prd)

// calculate the Center line using pivot points
var float center = na
float lastpp = ph ? ph : pl ? pl : na
if lastpp
    if na(center)
        center := lastpp
    else
        //weighted calculation
        center := (center * 2 + lastpp) / 3

// upper/lower bands calculation
Up = center - (Factor * atr(Pd))
Dn = center + (Factor * atr(Pd))

// get the trend
float TUp = na
float TDown = na
Trend = 0
TUp := close[1] > TUp[1] ? max(Up, TUp[1]) : Up
TDown := close[1] < TDown[1] ? min(Dn, TDown[1]) : Dn
Trend := close > TDown[1] ? 1: close < TUp[1]? -1: nz(Trend[1], 1)
Trailingsl = Trend == 1 ? TUp : TDown

// plot the trend
linecolor = Trend == 1 and nz(Trend[1]) == 1 ? color.lime : Trend == -1 and nz(Trend[1]) == -1 ? color.red : na
plot(Trailingsl, color = linecolor ,  linewidth = 2, title = "PP SuperTrend")

plot(showcl ? center : na, color = showcl ? center < hl2 ? color.blue : color.red : na)

// check and plot the signals
bsignal = Trend == 1 and Trend[1] == -1
ssignal = Trend == -1 and Trend[1] == 1
plotshape(bsignal and showlabel ? Trailingsl : na, title="Buy", text="Buy", location = location.absolute, style = shape.labelup, size = size.tiny, color = color.lime, textcolor = color.black, transp = 0)
plotshape(ssignal and showlabel ? Trailingsl : na, title="Sell", text="Sell", location = location.absolute, style = shape.labeldown, size = size.tiny, color = color.red, textcolor = color.white, transp = 0)

//get S/R levels using Pivot Points
float resistance = na
float support = na
support := pl ? pl : support[1]
resistance := ph ? ph : resistance[1]

// if enabled then show S/R levels
plot(showsr and support ? support : na, color = showsr and support ? color.lime : na, style = plot.style_circles, offset = -prd)
plot(showsr and resistance ? resistance : na, color = showsr and resistance ? color.red : na, style = plot.style_circles, offset = -prd)

// alerts
alertcondition(Trend == 1 and Trend[1] == -1, title='Buy Signal', message='Buy Signal')
alertcondition(Trend == -1 and Trend[1] == 1, title='Sell Signal', message='Sell Signal')
alertcondition(change(Trend), title='Trend Changed', message='Trend Changed')


if Trend == 1 and Trend[1] == -1
    strategy.entry("Enter Long", strategy.long)
else if Trend == -1 and Trend[1] == 1
    strategy.entry("Enter Short", strategy.short)
Relationnée
- Stratégie de super-tendance à pivot dynamique
- La progression de Fibonacci avec des pauses
- Baguette à base de grains multiples
- Supertrend à l'arrière avec arrêt de traînée
- La machine à meuler
- Sortie du lustre
- AlphaTrend utilisation de la méthode
- Blocs d'ordre pivot
- Points de pivotement haut bas multi-temps
- Maxima et minima de suivi basés sur pivot
Plus de
- Ratio énergie directionnelle accélérée par volume RedK
- Pas de peinture.
- Les barres de dynamique REDK
- Superjump retourner en arrière Bollinger Band
- La tendance de Fukuiz
- Le BOT de Johnny
- SSL hybride
- Sortie du lustre
- Le rizotto
- Stratégie intraday de l'EMA dans le cloud
- Supertrend+4 en mouvement
- ZigZag basé sur l'élan
- VuManChu chiffrement B + stratégie de divergence
- Concept du double SuperTrend
- Super scalper
- Tests de retour - indicateur
- Des tendances
- Le tueur de Sma BTC
- Modèle d'alerte ML
- La progression de Fibonacci avec des pauses