La tendance de Fukuiz
Auteur:ChaoZhang est là., Date: 2022-05-18 10h25 et 47 minLes étiquettes:RMAIndice de résistance
Cet indicateur est basé sur le RSI de 2 périodes différentes.
Une brève introduction au RSI L'indice de force relative (RSI) est un indicateur de dynamique utilisé dans l'analyse technique qui mesure l'ampleur des changements de prix récents pour évaluer les conditions de surachat ou de survente dans le prix d'un stock ou d'un autre actif.
L'interprétation et l'utilisation traditionnelles du RSI sont que les valeurs de 70 ou plus indiquent qu'un titre devient suracheté ou surévalué et peut être préparé pour un renversement de tendance ou un recul correctif du prix.
Dans cet indicateur Je vois que vous pouvez utiliser 2 RSI avec des périodes différentes pour suggérer une tendance haussière et une tendance baissière.
# Conditions entre le long et le court passage RSI # Crossover = tendance haussière (zone bleue) Crossunder = tendance baissière (zone rouge)
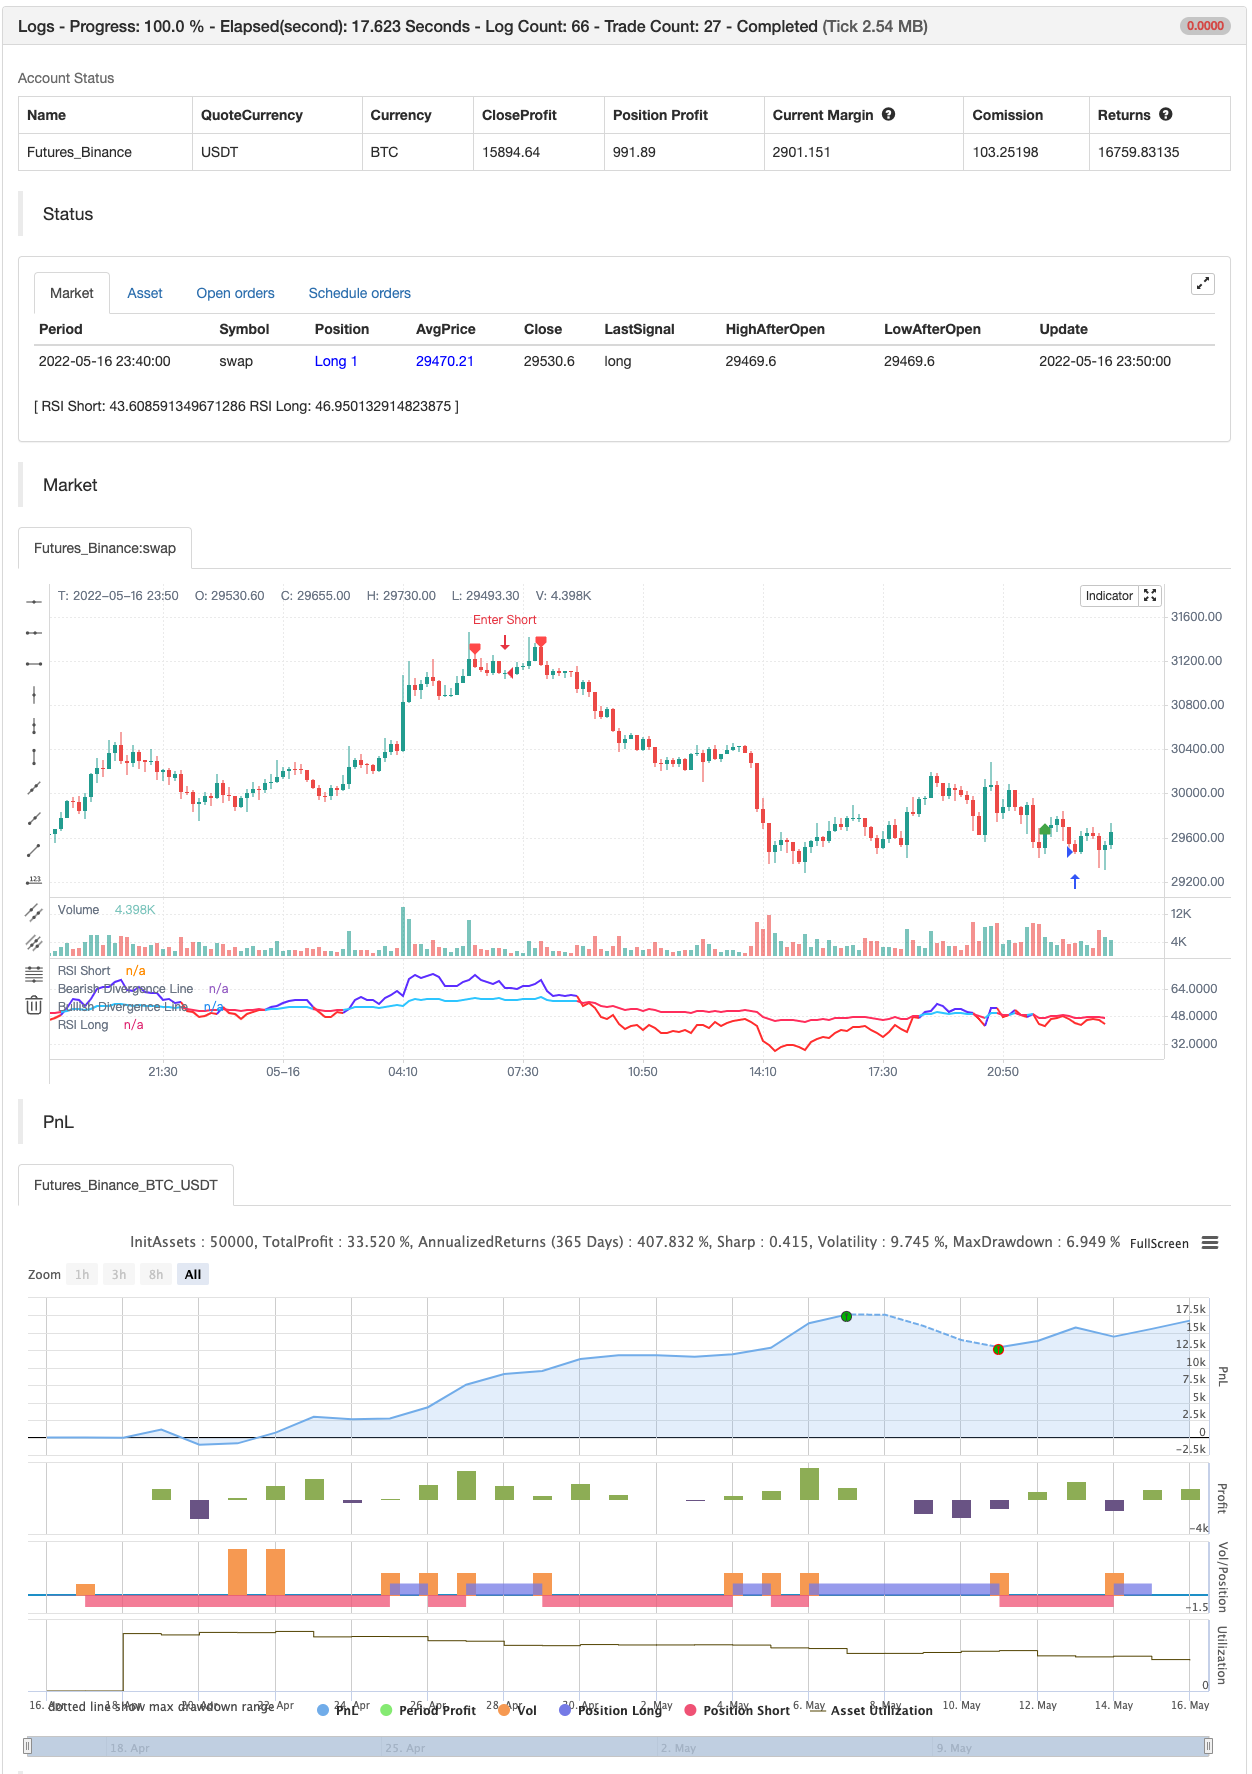
test de retour
/*backtest
start: 2022-04-17 00:00:00
end: 2022-05-16 23:59:00
period: 10m
basePeriod: 1m
exchanges: [{"eid":"Futures_Binance","currency":"BTC_USDT"}]
*/

//@version=5
//Fukuiz
indicator(title='Fukuiz Trend', shorttitle='Fukuiz Trend', format=format.price, precision=2, timeframe='')

//color//
colorwhite = #FFFFFF
colorblue = #6633FF
colorred = #FF3333
colorblue2 = #33CCFF
colorpink = #FF3366

//Fuction//
len = input.int(24, minval=1, title='RSI Short')
len2 = input.int(100, minval=1, title='RSI Long')
src = input(open, 'Source')
up = ta.rma(math.max(ta.change(src), 0), len)
down = ta.rma(-math.min(ta.change(src), 0), len)
up2 = ta.rma(math.max(ta.change(src), 0), len2)
down2 = ta.rma(-math.min(ta.change(src), 0), len2)
rsi = down == 0 ? 100 : up == 0 ? 0 : 100 - 100 / (1 + up / down)
rsi2 = down2 == 0 ? 100 : up2 == 0 ? 0 : 100 - 100 / (1 + up2 / down2)

Bullish = rsi > rsi2
Bearish = rsi < rsi2
Fukuizcolor = Bullish ? color.new(colorblue,0) : Bearish ? color.new(colorred,0) : na
Fukuizcolor2 = Bullish ? color.new(colorblue2,0) : Bearish ? color.new(colorpink,0) : na
Fukuizcolor3 = Bullish ? color.new(colorblue,75) : Bearish ? color.new(colorred,75) : na

//Plot//
l1 = plot(rsi, 'RSI Short', color=Fukuizcolor, linewidth=2, style=plot.style_line)
l2 = plot(rsi2, 'RSI Long', color=Fukuizcolor2, linewidth=2, style=plot.style_line)
band2 = hline(50, 'Middle Band', color=#FFCC99)
band1 = hline(70, 'Upper Band', color=#FFCC99)
band0 = hline(30, 'Lower Band', color=#FFCC99)
fill(band1, band0, color.new(#0946CA, 90), title='Background')
fill(l1, l2, color=Fukuizcolor3, title='Trend Background')


//DIVERGENCE//
lbR = input(title='Pivot Lookback Right', defval=5)
lbL = input(title='Pivot Lookback Left', defval=5)
rangeUpper = input(title='Max of Lookback Range', defval=60)
rangeLower = input(title='Min of Lookback Range', defval=5)
plotBull = input(title='Bullish Divergence', defval=true)
plotBear = input(title='Bearish Divergence', defval=true)
bearColor = color.red
bullColor = color.green
hiddenBullColor = color.new(color.green, 80)
hiddenBearColor = color.new(color.red, 80)
textColor = color.white
noneColor = color.new(color.white, 100)
osc = ta.rsi(src, len)

plFound = na(ta.pivotlow(osc, lbL, lbR)) ? false : true
phFound = na(ta.pivothigh(osc, lbL, lbR)) ? false : true
_inRange(cond) =>
    bars = ta.barssince(cond == true)
    rangeLower <= bars and bars <= rangeUpper

oscHL = osc[lbR] > ta.valuewhen(plFound, osc[lbR], 1) and _inRange(plFound[1])
priceLL = low[lbR] < ta.valuewhen(plFound, low[lbR], 1)
bullCond = plotBull and priceLL and oscHL and plFound

plot(plFound ? osc[lbR] : na, offset=-lbR, title='Bullish Divergence Line', linewidth=2, color=bullCond ? bullColor : noneColor,display=display.none)

plotshape(bullCond ? osc[lbR] : na, offset=-lbR, title='Bullish Divergence Label', text=' Bull ', style=shape.labelup, location=location.absolute, color=color.new(bullColor, 0), textcolor=color.new(textColor, 0))

oscLH = osc[lbR] < ta.valuewhen(phFound, osc[lbR], 1) and _inRange(phFound[1])
priceHH = high[lbR] > ta.valuewhen(phFound, high[lbR], 1)
bearCond = plotBear and priceHH and oscLH and phFound

plot(phFound ? osc[lbR] : na, offset=-lbR, title='Bearish Divergence Line', linewidth=2, color=bearCond ? bearColor : noneColor,display=display.none)

plotshape(bearCond ? osc[lbR] : na, offset=-lbR, title='Bearish Divergence Label', text=' Bear ', style=shape.labeldown, location=location.absolute, color=color.new(bearColor, 0), textcolor=color.new(textColor, 0))


if bullCond
    strategy.entry("Enter Long", strategy.long)
else if bearCond
    strategy.entry("Enter Short", strategy.short)
- Super scalper - 5 minutes 15 minutes
- Scalping EMA ADX RSI avec achat/vente
- RSI - Signaux d'achat et de vente
- Stratégie d'optimisation statistique du RSI
- Stratégie de l'indice de résistance relative de l'indice RSI
- RSI par zdmre
- RSI MTF Ob+Os
- Le TMA-Legacy
- SuperTREX
- Bollinger + RSI, stratégie double v1.1
- Indicateur MACD personnalisé CM - Cadre temporel multiple - V2
- Ligne de détection
- 2 Détection de la direction des couleurs moyennes mobiles
- L'outil R1 pour le scalping PullBack
- La stratégie d'achat et de vente dépend de AO+Stoch+RSI+ATR
- Le montant de l'aide est calculé en fonction de l'évolution de la situation.
- Ratio énergie directionnelle accélérée par volume RedK
- Pas de peinture.
- Les barres de dynamique REDK
- Superjump retourner en arrière Bollinger Band
- Le BOT de Johnny
- SSL hybride
- Sortie du lustre
- Le rizotto
- Stratégie intraday de l'EMA dans le cloud
- Supertendance du point pivot
- Supertrend+4 en mouvement
- ZigZag basé sur l'élan
- VuManChu chiffrement B + stratégie de divergence
- Concept du double SuperTrend